How to Use Windows Debugger to Troubleshoot Bluescreens
Summary: Learn how to download Windows Debugger (WinDbg) and run it to read minidump files and troubleshoot bluescreen errors in a Windows operating system.
This article applies to
This article does not apply to
This article is not tied to any specific product.
Not all product versions are identified in this article.
Instructions
If your computer experiences a bluescreen, how can you find out what happened, fix the issue and it prevent it from happening again? You may find the memory dump file useful in this situation. The memory dump file contains the smallest amount of useful information that could help you identify why your computer experienced a bluescreen. Windows Debugger, also known as WinDbg, is a tool made by Microsoft to help troubleshoot bluescreen minidumps. Windows Debugger is a tool that helps you read the minidump file.
The memory dump file contains the following information:
- The stop message, its parameters, and other data
- A list of loaded drivers
- The processor context (
PRCB) for the processor that stopped - The process information and kernel context (
EPROCESS) for the process that stopped - The process information and kernel context (
ETHREAD) for the thread that stopped - The Kernel-mode call stack for the thread that stopped
Follow the step-by-step instructions below to learn how to read .dmp (dump) files.
Affected Operating Systems:
- Windows 11
- Windows 10
Causes for blue screen errors vary. Hardware failures or software corruption are both possible.
To use Windows Debugger, Install and Run WinDbg Preview, Analyze a Dump File, then Review the Analysis Results. You may also Use the Driver Verifier Tool to Gather Information. Click the appropriate subject for more information.
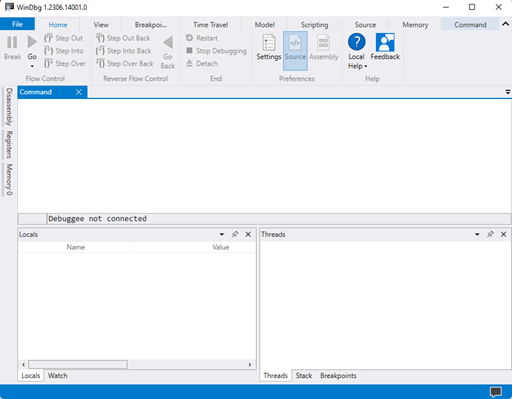
Install and Run
WinDbg must be installed to open and read a memory dump file. These steps show how to download and install WinDbg.
- Search for
WinDbgin the Microsoft Store and then download WinDbg Preview.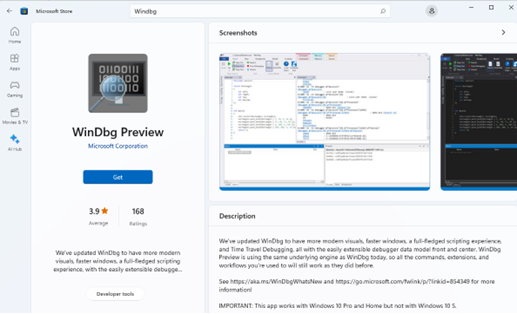
- After installing the app, open WinDbg Preview from Windows Search.
Analyze a Dump File
With WinDbg installed, follow these steps to read the memory dump file.
- Click the File menu.
- Click Settings, click Debugging settings, and then locate the Default symbol path. In the Default symbol path, type
srv*https://msdl.microsoft.com/download/symbolsand then click OK.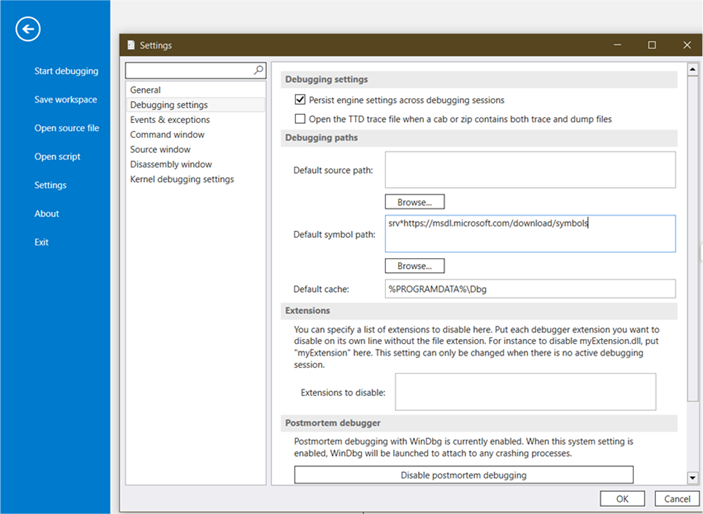 Note: For more information about the symbol path, reference Symbol path for Windows debuggers
.
- Click File, click Open source file, and then click Open dump file. From here, Browse to a dump file and then click Open.
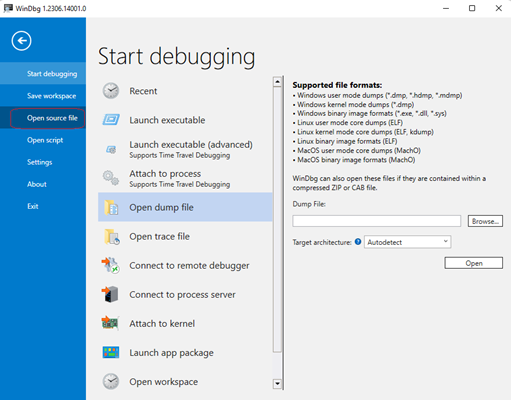 Note: Crash dump files for apps and Windows dump files may be analyzed after browsing to the appropriate location of the Dump File. For example, two common locations where your mini dump file may be located are:
C:\Users\XYZ\AppData\Local\CrashDumps\C:\Windows\Minidump\
- Analyze the file by typing
!analyze -vand then press Enter.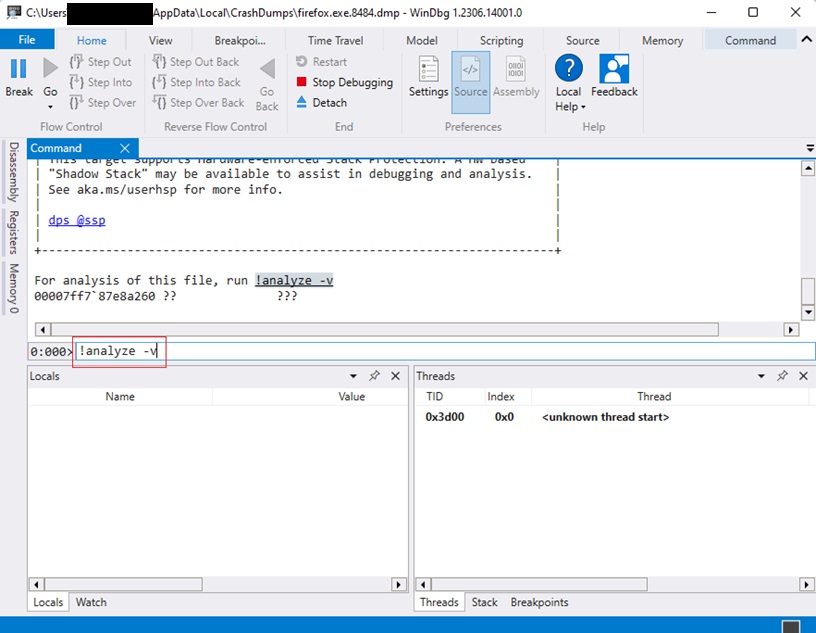
- Once the analysis is complete, Windows Debugger shows the file causing the bluescreen. Review the analysis
MODULE_NAMEorIMAGE_NAMEfor the file. Reviewing the results can lead to further troubleshooting steps and potentially reveal the cause of the error.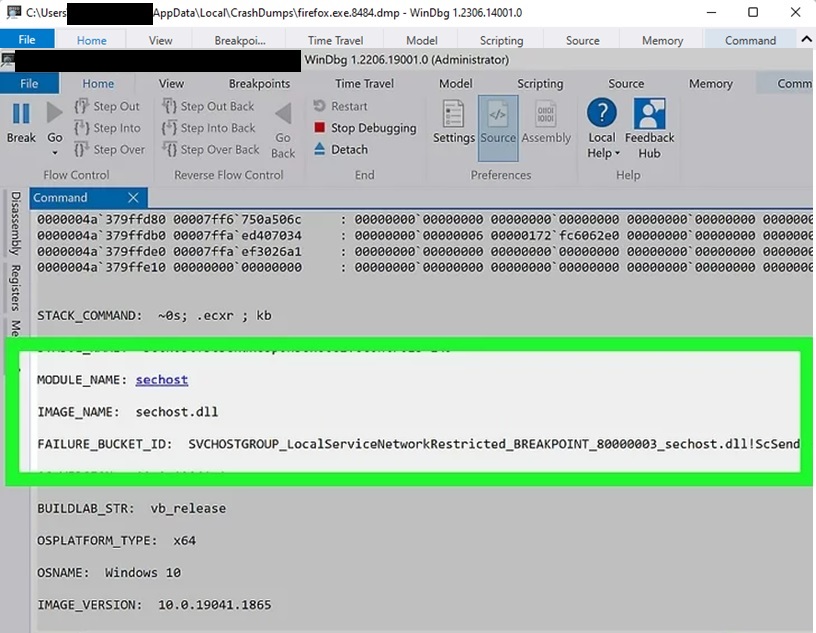
Review the Analysis Results
For more information about the error, reference the Bug Check Codes from Bug Check Code Reference.
For more information about blue screen error code confirmation links, reference Advanced Troubleshooting for Stop or Blue Screen Errors.
For more information about file Information, reference Process Explorer.
For more information about resolving blue screens, reference Resolving Blue Screen errors in Windows.
For more information about Windows Debugger, reference Analyze a kernel-mode dump file by using WinDbg.
For more information about the analyze extension, reference Using the !analyze Extension and !analyze (WinDbg)
.
Use the Driver Verifier Tool to Gather Information
Approximately 75% of blue screen errors are caused by driver issues. The Driver Verifier tool runs in real-time to examine the behavior of installed drivers. The driver verifier manager is built into Windows and is available on all Windows computers.
Follow these steps to start the driver verifier manager:
- Click Search in the Taskbar and type
CMDin the field. - Right-click Command Prompt and select Run as administrator.
- Type
Verifierin Command Prompt.
You can specify which drivers you would like to verify. The verify tool adds all drivers associated to the driver being verified as it runs, so try to verify the smallest number of drivers as possible. For more information, see Driver Verifier.
Affected Products
Alienware, Dell All-in-One, Dell Pro All-in-One, Dell Pro Max Micro, Dell Pro Max Slim, Dell Pro Max Tower, Dell Pro Micro, Dell Pro Slim, Dell Pro Tower, Dell Slim, Dell Tower, Inspiron, Legacy Desktop Models, OptiPlex, Vostro, XPS, G Series
, G Series, Alienware, Dell Plus, Dell Pro, Dell Pro Max, Dell Pro Plus, Dell Pro Premium, Inspiron, Latitude, Dell Pro Rugged, Vostro, XPS, Legacy Laptop Models, Fixed Workstations, Mobile Workstations, Dell Pro Max Micro XE FCM2250, Dell Pro Max Slim XE FCS1250, Dell Pro Max Tower T2 XE FCT2250, Dell Pro Max 16 XE MC16250, Dell Pro Micro Plus XE QBM1250, Dell Pro Slim Plus XE5 QBS1250, Dell Pro Tower Plus XE5 QBT1250
...
Article Properties
Article Number: 000149411
Article Type: How To
Last Modified: 17 Jul 2025
Version: 12
Find answers to your questions from other Dell users
Support Services
Check if your device is covered by Support Services.