Windows Server: Analyzing a Storport Trace with Excel and Xperf
Summary: This article and the accompanying video describe a way of examining the resulting ETL file from a storport trace to extract useful troubleshooting information.
This article applies to
This article does not apply to
This article is not tied to any specific product.
Not all product versions are identified in this article.
Instructions
Prerequisites:
This how-to guide assumes that a storport event trace log (ETL) file has already been collected.
For guidance on collecting the ETL file, see "Capturing a Storport Trace."
To examine the ETL file the following needs to be installed on the computer used for examination:
- Powershell
- Microsoft Office Excel
- Windows Performance Toolkit (for the Xperf command-line tool)
To convert the ETL file to a comma-delimited file (CSV):
- Copy the ETL file to the computer that will be used for examination.
- Open Powershell and type:
xperf -i D:\Path\storport.etl -o D:\Path\storport.csv
(Replace "D:\Path" with the drive letter and directory path to which the ETL file was copied in step 1.)
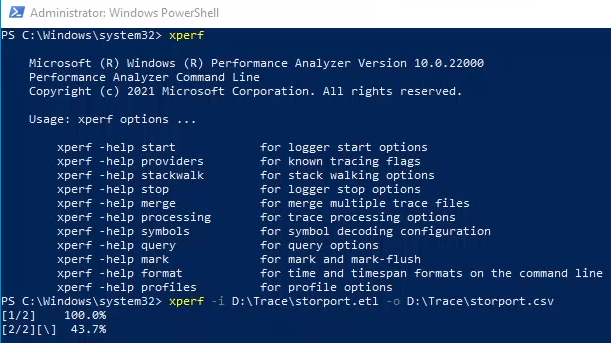
This creates a comma-delimited file (CSV) named
storport.csv. This file can now be opened in Microsoft Office Excel. However, if the trace ran for an extended number of minutes, resulting in a large ETL file and a comma delimited file with over a million rows, the following message is displayed when trying to open it in Excel:

In this case, it is convenient to use PowerShell to extract only the relevant lines from the comma-delimited file and, with these, create a new comma-delimited file before opening it in Excel.
To filter the CSV file to extract relevant lines:
When troubleshooting a performance issue, the storport trace lines that are relevant in the ETL/CSV file start with "Microsoft-Windows-Storport/Port/win:Info."
To create a new CSV file that shows only the lines of interest:
- Back in Powershell, enter the command:
Get-Content D:\Path\storport.csv | Where-Object {$_ -like "Microsoft-Windows-Storport/Port/win:Info*"} | Set-Content D:\Path\filtered_storport.csv
(Replace "
D:\Path" with the drive letter and directory path containing the source CSV file created in step 2.)
Analyze the results in Microsoft Office Excel:
- The resulting filtered CSV file can be sorted and filtered by columns "Timestamp," "RequestDuration_100ns" and "Target."
- Use average functions to calculate average latency.
- "Timestamp" is a clock or timer used for calculating how long the I/O request takes to complete.
- "
RequestDuration_100ns" is the number of hundred's of nanoseconds the I/O request took to complete. - "Target" sees the disk number (disk 0, disk 1, disk 2, etc.)
Highlighting the "
RequestDuration_100ns" column, you can get an idea of the average latency:

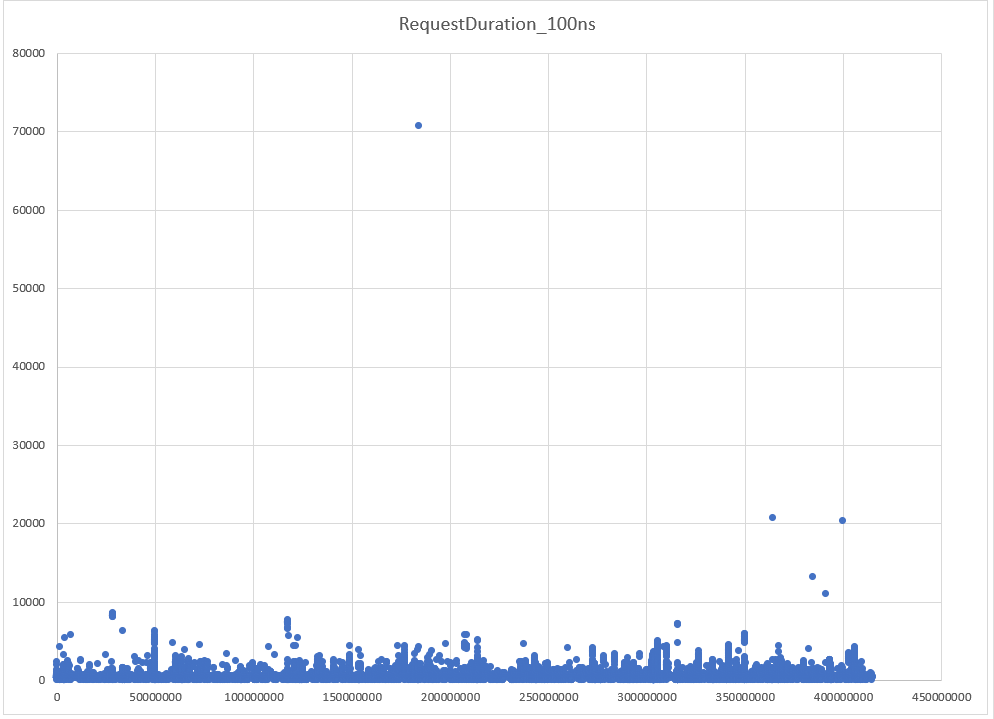
Using common Excel filters and charts can help visualize the data easier. For instance, the chart below, shows the scattered plot of the various I/O requests captured during the
storport trace for disk #1. This is accomplished by creating a scattered chart with the columns "Timestamp" and "RequestDuration_100ns" and then filtering the raw data table on the "Target" column by "1":

Notice that although most I/O requests are taking below 100 ms to complete, a significant number takes over 100 ms; some more over 200 ms and there are some taking over 300 ms.
If the issue being investigated in this example is a disk performance bottleneck, this would be a critical aspect to consider in determining if there is disk contention.
Similarly, the chart below shows the various I/O requests during the
storport trace but this time for disk #2 (accomplished filtering the raw data table on the "Target" column by "2"):
On this second chart, the significant majority of I/O requests to disk #2 accumulates well below 15 ms (the average is 0.06 ms). It would be accurate to say that this disk #2 is showing no signs of contention during this
storport trace.
Additional Information
Refer to this video:
Affected Products
Microsoft Windows Server 2016, Microsoft Windows Server 2019, Microsoft Windows Server 2022Products
PowerEdge XR2, PowerEdge FC640, PowerEdge M640, PowerEdge M640 (for PE VRTX), PowerEdge MX5016s, PowerEdge MX740C, PowerEdge MX750c, PowerEdge MX760c, PowerEdge MX840C, PowerEdge R240, PowerEdge R250, PowerEdge R260, PowerEdge R340, PowerEdge R350
, PowerEdge R360, PowerEdge R440, PowerEdge R450, PowerEdge R540, PowerEdge R550, PowerEdge R640, PowerEdge R6415, PowerEdge R650, PowerEdge R650xs, PowerEdge R6515, PowerEdge R6525, PowerEdge R660, PowerEdge R660xs, PowerEdge R6615, PowerEdge R6625, PowerEdge R740, PowerEdge R740XD, PowerEdge R740XD2, PowerEdge R7415, PowerEdge R7425, PowerEdge R750, PowerEdge R750XA, PowerEdge R750xs, PowerEdge R7515, PowerEdge R7525, PowerEdge R760, PowerEdge R760XA, PowerEdge R760xd2, PowerEdge R760xs, PowerEdge R7615, PowerEdge R7625, PowerEdge R840, PowerEdge R860, PowerEdge R940, PowerEdge R940xa, PowerEdge R960, PowerEdge T140, PowerEdge T150, PowerEdge T160, PowerEdge T340, PowerEdge T350, PowerEdge T360, PowerEdge T440, PowerEdge T550, PowerEdge T560, PowerEdge T640, PowerEdge XR11, PowerEdge XR12
...
Article Properties
Article Number: 000204350
Article Type: How To
Last Modified: 02 Jan 2025
Version: 3
Find answers to your questions from other Dell users
Support Services
Check if your device is covered by Support Services.