VxRail: Physical view not showing due to node not response to "esxcli" command
Summary: VxRail cluster node physical view missing, node not response to "esxcli" command, NTP is not synced.
This article applies to
This article does not apply to
This article is not tied to any specific product.
Not all product versions are identified in this article.
Symptoms
-
All nodes' physical views are missing.
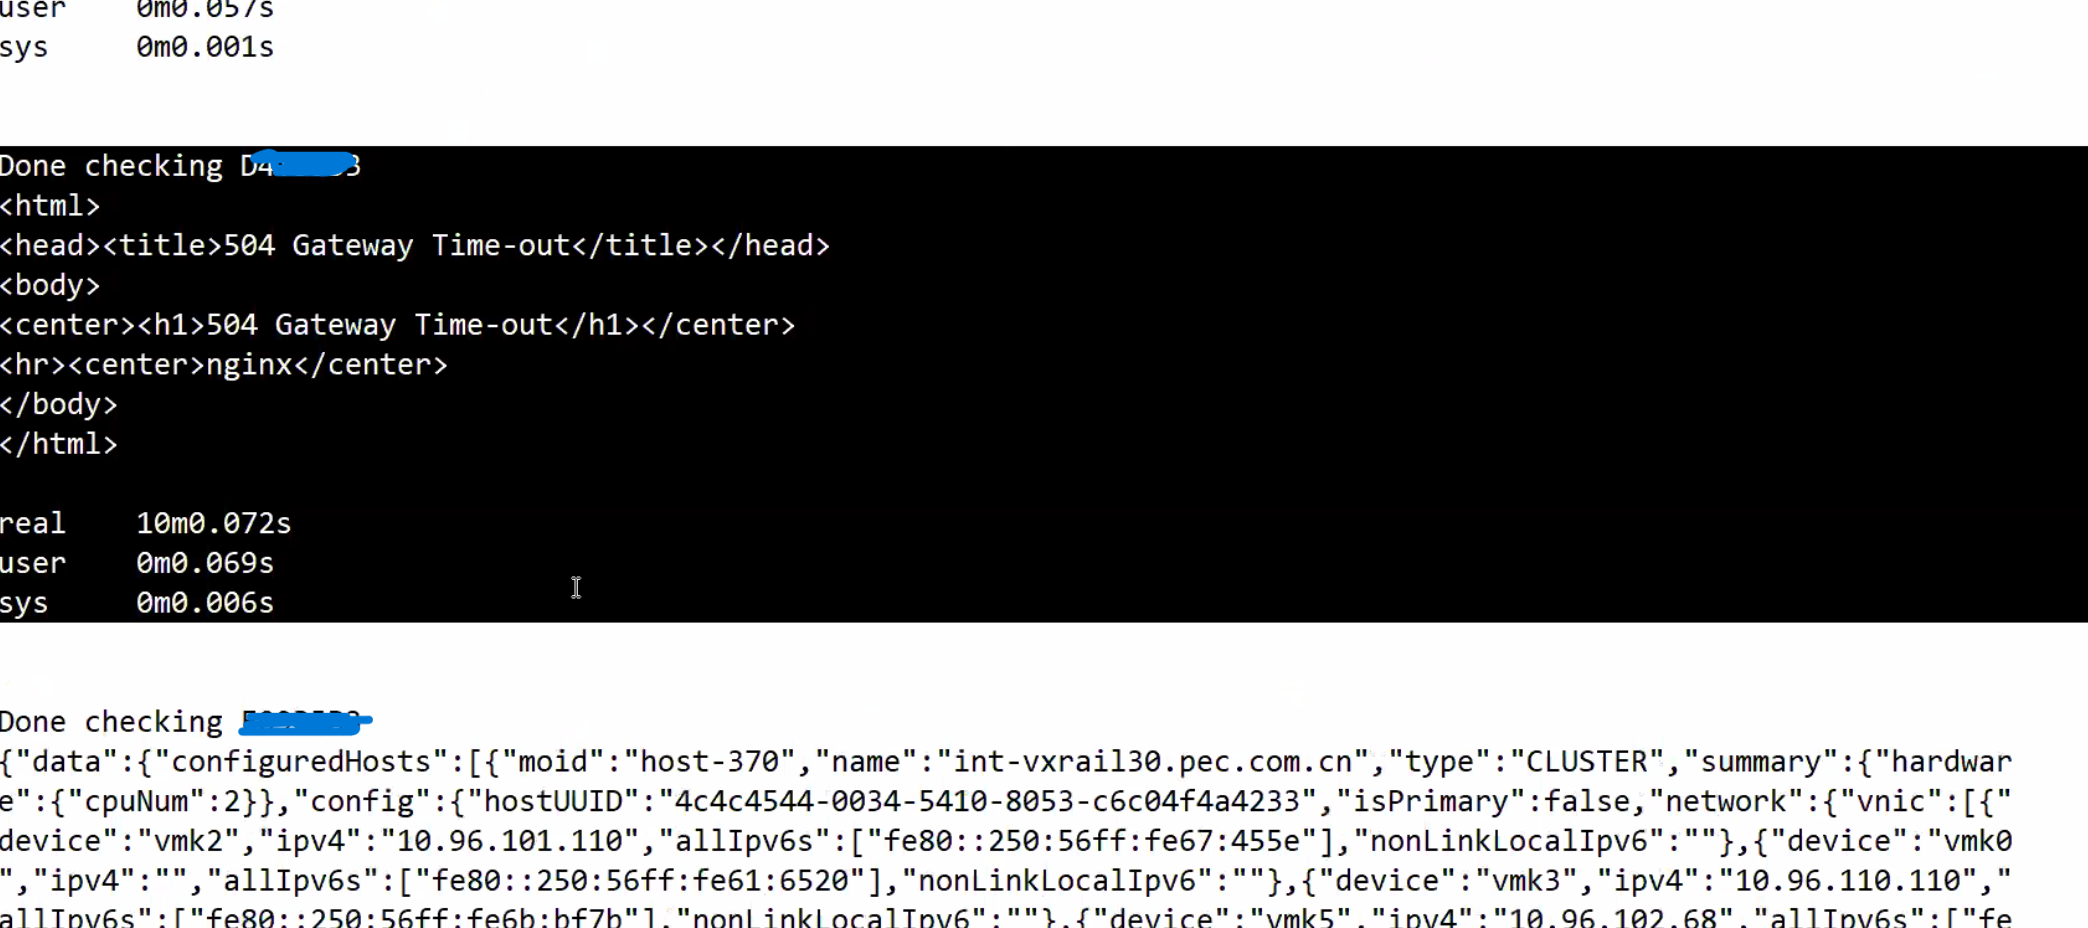
From web.log, the API gateway timed out after 10 minutes of the physical view data fetching:2023-11-20T09:24:31.039Z <7527c8d153655e9bbb43b32dcd312443> marvin [ERROR] <261> ApplianceServiceImpl.java populatePvCache() (276): failed to fetch data. javax.ws.rs.ServerErrorException: HTTP 504 Gateway Time-out at org.glassfish.jersey.client.JerseyInvocation.createExceptionForFamily(JerseyInvocation.java:1125) ~[jersey-client-2.27.jar:?] at org.glassfish.jersey.client.JerseyInvocation.convertToException(JerseyInvocation.java:1105) ~[jersey-client-2.27.jar:?] at org.glassfish.jersey.client.JerseyInvocation.translate(JerseyInvocation.java:883) ~[jersey-client-2.27.jar:?] at org.glassfish.jersey.client.JerseyInvocation.lambda$invoke$1(JerseyInvocation.java:767) ~[jersey-client-2.27.jar:?] at org.glassfish.jersey.internal.Errors.process(Errors.java:316) ~[jersey-common-2.27.jar:?] at org.glassfish.jersey.internal.Errors.process(Errors.java:298) ~[jersey-common-2.27.jar:?] at org.glassfish.jersey.internal.Errors.process(Errors.java:229) ~[jersey-common-2.27.jar:?] at org.glassfish.jersey.process.internal.RequestScope.runInScope(RequestScope.java:414) ~[jersey-common-2.27.jar:?] at org.glassfish.jersey.client.JerseyInvocation.invoke(JerseyInvocation.java:765) ~[jersey-client-2.27.jar:?] at org.glassfish.jersey.client.JerseyInvocation$Builder.method(JerseyInvocation.java:456) ~[jersey-client-2.27.jar:?] at org.glassfish.jersey.client.JerseyInvocation$Builder.post(JerseyInvocation.java:357) ~[jersey-client-2.27.jar:?] at com.vce.commons.domainowner.graphq.DefaultQueryExecutorImpl.doJsonRequestExecution(DefaultQueryExecutorImpl.java:139) ~[commons-7.0.480.jar:?] at com.vce.commons.domainowner.graphq.DefaultQueryExecutorImpl.execute(DefaultQueryExecutorImpl.java:94) ~[commons-7.0.480.jar:?] at com.emc.mystic.manager.graphql.client.host.HostQuery.configuredHosts(HostQuery.java:138) ~[do-host-graphql-client-1.20.41.jar:?] at com.emc.mystic.manager.graphql.client.host.HostQuery.configuredHosts(HostQuery.java:102) ~[do-host-graphql-client-1.20.41.jar:?] at com.vce.commons.domainowner.node.NodeRepository.getAllClusterNodeData(NodeRepository.java:1997) ~[commons-7.0.480.jar:?] at com.emc.mystic.manager.cluster.service.ApplianceServiceImpl.getAllHostData(ApplianceServiceImpl.java:543) ~[classes/:?] at com.emc.mystic.manager.cluster.service.ApplianceServiceImpl.populatePvCache(ApplianceServiceImpl.java:260) ~[classes/:?] at com.emc.mystic.manager.cluster.service.ApplianceServiceImpl.lambda$updateCacheTask$6(ApplianceServiceImpl.java:320) ~[classes/:?] at java.util.concurrent.FutureTask.run(FutureTask.java:264) [?:?] at java.util.concurrent.ThreadPoolExecutor.runWorker(ThreadPoolExecutor.java:1128) [?:?] at java.util.concurrent.ThreadPoolExecutor$Worker.run(ThreadPoolExecutor.java:628) [?:?] at java.lang.Thread.run(Thread.java:829) [?:?] 2023-11-20T09:24:31.045Z <7527c8d153655e9bbb43b32dcd312443> marvin [INFO] <261> ApplianceServiceImpl.java lambda$updateCacheTask$6() (321): Success to refresh cache for node: <node SN> 2023-11-20T09:24:31.046Z <7527c8d153655e9bbb43b32dcd312443> marvin [INFO] <59> ApplianceDataRoot.java refreshVxRailClusterTag() (289): Skip refreshing VxRail-Cluster-Tag triggered by scheduled job as it has already been done within 15 minutes. 2023-11-20T09:24:31.046Z <7527c8d153655e9bbb43b32dcd312443> marvin [INFO] <59> ApplianceDataRoot.java fetchData() (357): [VXMPERF] PV fetch data execution time in 602 seconds
-
Run the command below on the VxRail manager to query node physical view data:
#curl -X GET --unix-socket /var/lib/vxrail/nginx/socket/nginx.sock http://127.0.0.1/rest/vxm/internal/do/v1/host/query -H 'Content-Type: application/json' -d '{"query":"{ configuredHosts { hardware { sn } } }"}' 2>/dev/null | jq | egrep "name|sn" | awk -F\" '/sn/{print $4}' | sort -u | while read sn; do time curl -X POST --unix-socket /var/lib/vxrail/nginx/socket/nginx.sock -H 'Content-Type: application/json' -d '{"variables":"{\"sn\":\"'${sn}'\"}","query":"query ($sn:[String]){ configuredHosts(sn:$sn) { moid name type summary{ hardware{ cpuNum}} config{ hostUUID isPrimary network{ vnic{ device ipv4 allIpv6s nonLinkLocalIpv6} idrac{ ipAddress ipAddressSource netmask gateway ipAddressV6 gatewayV6 prefixLen ipv6AutoConfig vlan{ enabled id priority}}} localSlotClaims{ slot bay type usage diskgroupId} diskgroup{ slotNum current{ type}} installedComponent{ displayName version model description installedTime}} runtime{ connectionState overallStatus powerState inMaintenanceMode} hardware{ sn psnt slot manufacturer name systemStatusLed tpm model firmware{ id model} firmwareRevisions{ idsdmFwRevision biosFwRevision bmcFwRevision diskCtrlFwRevision bossFwRevision cpldFwRevision expanderBackplane nonExpanderBackplane dcpmFwRevision percDiskCtrlFwRevision} baseline{ sn slot chassisId isMissing} chassis{ name model psnt partNumber serviceTag psus{ sn name slot manufacturer partNumber firmwareVersion baseline{ sn slot isMissing}}} disks{ sn guid capacity slot firmwareVersion diskType diskState manufacturer protocol maxCapableSpeed model ledStatus writeEndurance bay enclosure remainingWriteEnduranceRate encryptionAbility encryptionStatus baseline{ sn slot bay isMissing}} bootDevices{ sn firmwareVersion sataType powerOnHours powerCycleCount avrEraseCount maxEraseCount capacity deviceModel slot health bootDeviceType status blockSizeBytes partNumber manufacturer controllerFirmware controllerModel controllerStatus raidStatus} nics{ mac linkSpeed firmwareFamilyVersion linkStatus fqdd specificNicType wwnn wwpn drivers{ driverName driverVersion}} position{ rackName rackSlot} storageInstance{ securityStatus encryptionMode}}} }","operationName":null}' http://0/rest/vxm/internal/do/v1/host/query; echo ""; echo ""; echo "Done checking $sn"; done -
Result showing one or more nodes did not return the data in 10 minutes:
Nodes in question have return error "504 Gateway Time-out" while working nodes have correct physical view data returned.
-
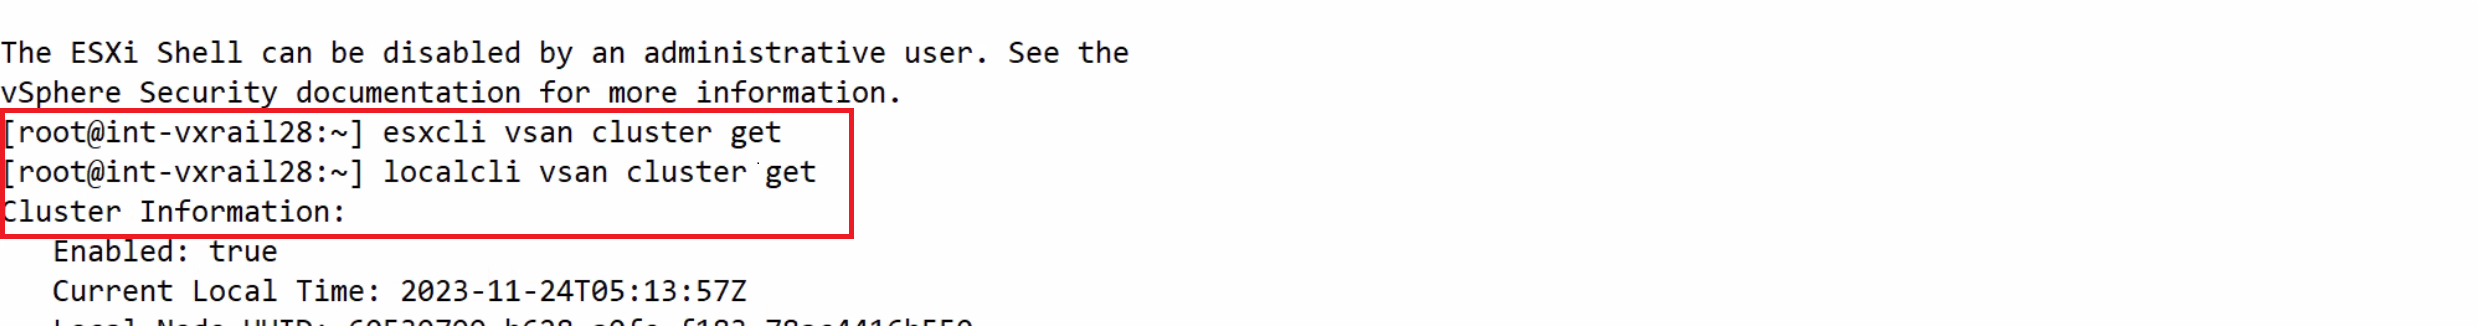
Base on the node SN identified as above, log in to the node and run
esxclicommand, it stuck but localcli works:
Cause
Node had an NTP sync issue that resulted in the esxcli command being stuck and no response.
VxRail physical view calls esxcli commands on node to retrieve firmware information, it fails to get the information when node stuck at running esxcli command.
Resolution
The solution is to identify the NTP syncing issue on all nodes and fixes it. See below steps for verifying the state of NTP on nodes:
-
Check /var/log/vobd.log for any error messages indicating that the system clock is no longer synchronized with upstream time servers.
-
If so, check the NTP server status.
#ntpq -p
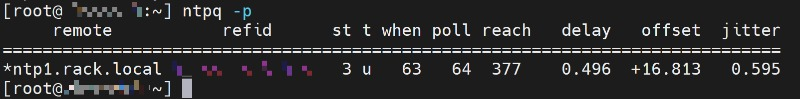
If the "reach" value is not 377, the host is missing NTP transaction, time on this ESXi might be incorrect and needs attention.
#ntpq -c
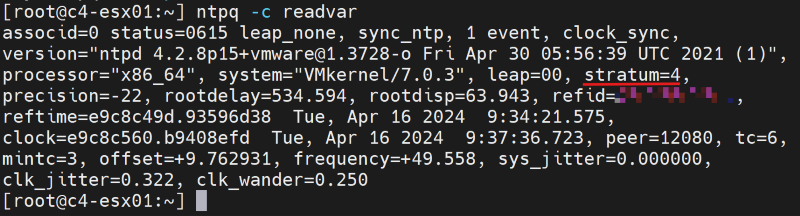
If the "stratum" value falls outside the range of 2 to 6, the time synchronization on this ESXi might experience additional delays, potentially resulting in inaccurate timekeeping.
-
Check if the NTP server address in the VxRail Manager database is correct with API.
curl -k --user "[vCenter account]:[vCenter password]" --request GET "https://localhost/rest/vxm/v1/system/ntp"
-
If not, then follow existing 'How To' Procedures (VxRail Procedures → Miscellaneous → 'How To' Procedures → Change VxRail IP Addresses → RePoint to a new NTP Server IP Address) to update the NTP server IP address.
-
Use another working NTP server if required, restart the node vpxa and host services, note that restarting the node vpxa and host services will temporarily fix the issue but the problem return if NTP fails to sync again.
/etc/init.d/vpxa restart
/etc/init.d/hostd restart
Affected Products
VxRailArticle Properties
Article Number: 000224344
Article Type: Solution
Last Modified: 24 May 2024
Version: 2
Find answers to your questions from other Dell users
Support Services
Check if your device is covered by Support Services.