VxRail: 노드가 "esxcli" 명령에 응답하지 않아 물리적 보기가 표시되지 않음
Summary: VxRail 클러스터 노드의 물리적 보기가 누락됨, 노드가 "esxcli" 명령에 응답하지 않음, NTP가 동기화되지 않습니다.
This article applies to
This article does not apply to
This article is not tied to any specific product.
Not all product versions are identified in this article.
Symptoms
-
모든 노드의 물리적 뷰가 누락되었습니다.
web.log부터 API 게이트웨이는 물리적 보기 데이터를 가져온 지 10분 후에 시간 초과되었습니다.2023-11-20T09:24:31.039Z <7527c8d153655e9bbb43b32dcd312443> marvin [ERROR] <261> ApplianceServiceImpl.java populatePvCache() (276): failed to fetch data. javax.ws.rs.ServerErrorException: HTTP 504 Gateway Time-out at org.glassfish.jersey.client.JerseyInvocation.createExceptionForFamily(JerseyInvocation.java:1125) ~[jersey-client-2.27.jar:?] at org.glassfish.jersey.client.JerseyInvocation.convertToException(JerseyInvocation.java:1105) ~[jersey-client-2.27.jar:?] at org.glassfish.jersey.client.JerseyInvocation.translate(JerseyInvocation.java:883) ~[jersey-client-2.27.jar:?] at org.glassfish.jersey.client.JerseyInvocation.lambda$invoke$1(JerseyInvocation.java:767) ~[jersey-client-2.27.jar:?] at org.glassfish.jersey.internal.Errors.process(Errors.java:316) ~[jersey-common-2.27.jar:?] at org.glassfish.jersey.internal.Errors.process(Errors.java:298) ~[jersey-common-2.27.jar:?] at org.glassfish.jersey.internal.Errors.process(Errors.java:229) ~[jersey-common-2.27.jar:?] at org.glassfish.jersey.process.internal.RequestScope.runInScope(RequestScope.java:414) ~[jersey-common-2.27.jar:?] at org.glassfish.jersey.client.JerseyInvocation.invoke(JerseyInvocation.java:765) ~[jersey-client-2.27.jar:?] at org.glassfish.jersey.client.JerseyInvocation$Builder.method(JerseyInvocation.java:456) ~[jersey-client-2.27.jar:?] at org.glassfish.jersey.client.JerseyInvocation$Builder.post(JerseyInvocation.java:357) ~[jersey-client-2.27.jar:?] at com.vce.commons.domainowner.graphq.DefaultQueryExecutorImpl.doJsonRequestExecution(DefaultQueryExecutorImpl.java:139) ~[commons-7.0.480.jar:?] at com.vce.commons.domainowner.graphq.DefaultQueryExecutorImpl.execute(DefaultQueryExecutorImpl.java:94) ~[commons-7.0.480.jar:?] at com.emc.mystic.manager.graphql.client.host.HostQuery.configuredHosts(HostQuery.java:138) ~[do-host-graphql-client-1.20.41.jar:?] at com.emc.mystic.manager.graphql.client.host.HostQuery.configuredHosts(HostQuery.java:102) ~[do-host-graphql-client-1.20.41.jar:?] at com.vce.commons.domainowner.node.NodeRepository.getAllClusterNodeData(NodeRepository.java:1997) ~[commons-7.0.480.jar:?] at com.emc.mystic.manager.cluster.service.ApplianceServiceImpl.getAllHostData(ApplianceServiceImpl.java:543) ~[classes/:?] at com.emc.mystic.manager.cluster.service.ApplianceServiceImpl.populatePvCache(ApplianceServiceImpl.java:260) ~[classes/:?] at com.emc.mystic.manager.cluster.service.ApplianceServiceImpl.lambda$updateCacheTask$6(ApplianceServiceImpl.java:320) ~[classes/:?] at java.util.concurrent.FutureTask.run(FutureTask.java:264) [?:?] at java.util.concurrent.ThreadPoolExecutor.runWorker(ThreadPoolExecutor.java:1128) [?:?] at java.util.concurrent.ThreadPoolExecutor$Worker.run(ThreadPoolExecutor.java:628) [?:?] at java.lang.Thread.run(Thread.java:829) [?:?] 2023-11-20T09:24:31.045Z <7527c8d153655e9bbb43b32dcd312443> marvin [INFO] <261> ApplianceServiceImpl.java lambda$updateCacheTask$6() (321): Success to refresh cache for node: <node SN> 2023-11-20T09:24:31.046Z <7527c8d153655e9bbb43b32dcd312443> marvin [INFO] <59> ApplianceDataRoot.java refreshVxRailClusterTag() (289): Skip refreshing VxRail-Cluster-Tag triggered by scheduled job as it has already been done within 15 minutes. 2023-11-20T09:24:31.046Z <7527c8d153655e9bbb43b32dcd312443> marvin [INFO] <59> ApplianceDataRoot.java fetchData() (357): [VXMPERF] PV fetch data execution time in 602 seconds
-
VxRail Manager에서 아래 명령을 실행하여 노드의 물리적 보기 데이터를 쿼리합니다.
#curl -X GET --unix-socket /var/lib/vxrail/nginx/socket/nginx.sock http://127.0.0.1/rest/vxm/internal/do/v1/host/query -H 'Content-Type: application/json' -d '{"query":"{ configuredHosts { hardware { sn } } }"}' 2>/dev/null | jq | egrep "name|sn" | awk -F\" '/sn/{print $4}' | sort -u | while read sn; do time curl -X POST --unix-socket /var/lib/vxrail/nginx/socket/nginx.sock -H 'Content-Type: application/json' -d '{"variables":"{\"sn\":\"'${sn}'\"}","query":"query ($sn:[String]){ configuredHosts(sn:$sn) { moid name type summary{ hardware{ cpuNum}} config{ hostUUID isPrimary network{ vnic{ device ipv4 allIpv6s nonLinkLocalIpv6} idrac{ ipAddress ipAddressSource netmask gateway ipAddressV6 gatewayV6 prefixLen ipv6AutoConfig vlan{ enabled id priority}}} localSlotClaims{ slot bay type usage diskgroupId} diskgroup{ slotNum current{ type}} installedComponent{ displayName version model description installedTime}} runtime{ connectionState overallStatus powerState inMaintenanceMode} hardware{ sn psnt slot manufacturer name systemStatusLed tpm model firmware{ id model} firmwareRevisions{ idsdmFwRevision biosFwRevision bmcFwRevision diskCtrlFwRevision bossFwRevision cpldFwRevision expanderBackplane nonExpanderBackplane dcpmFwRevision percDiskCtrlFwRevision} baseline{ sn slot chassisId isMissing} chassis{ name model psnt partNumber serviceTag psus{ sn name slot manufacturer partNumber firmwareVersion baseline{ sn slot isMissing}}} disks{ sn guid capacity slot firmwareVersion diskType diskState manufacturer protocol maxCapableSpeed model ledStatus writeEndurance bay enclosure remainingWriteEnduranceRate encryptionAbility encryptionStatus baseline{ sn slot bay isMissing}} bootDevices{ sn firmwareVersion sataType powerOnHours powerCycleCount avrEraseCount maxEraseCount capacity deviceModel slot health bootDeviceType status blockSizeBytes partNumber manufacturer controllerFirmware controllerModel controllerStatus raidStatus} nics{ mac linkSpeed firmwareFamilyVersion linkStatus fqdd specificNicType wwnn wwpn drivers{ driverName driverVersion}} position{ rackName rackSlot} storageInstance{ securityStatus encryptionMode}}} }","operationName":null}' http://0/rest/vxm/internal/do/v1/host/query; echo ""; echo ""; echo "Done checking $sn"; done -
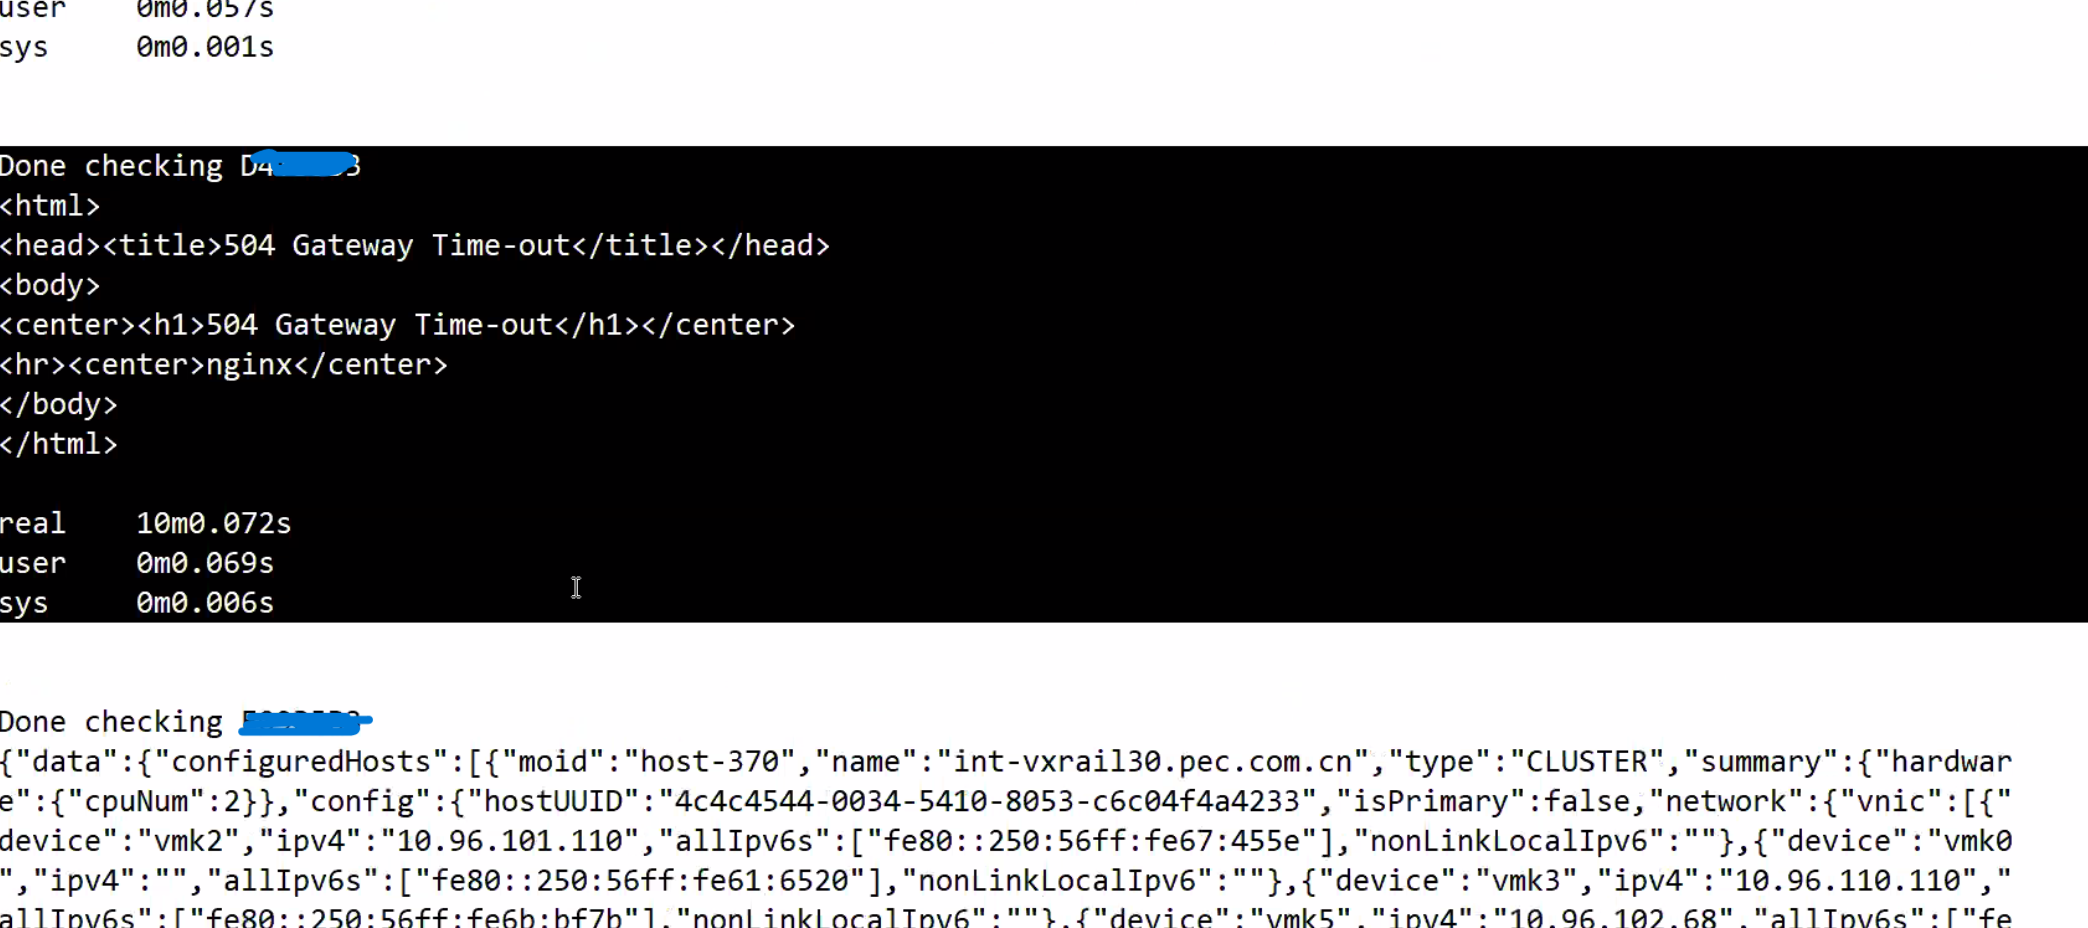
하나 이상의 노드가 10분 내에 데이터를 반환하지 않았음을 보여 주는 결과:
작업 중인 노드에는 올바른 물리적 보기 데이터가 반환되는 동안 "504 게이트웨이 시간 초과" 반환 오류가 있습니다.
-
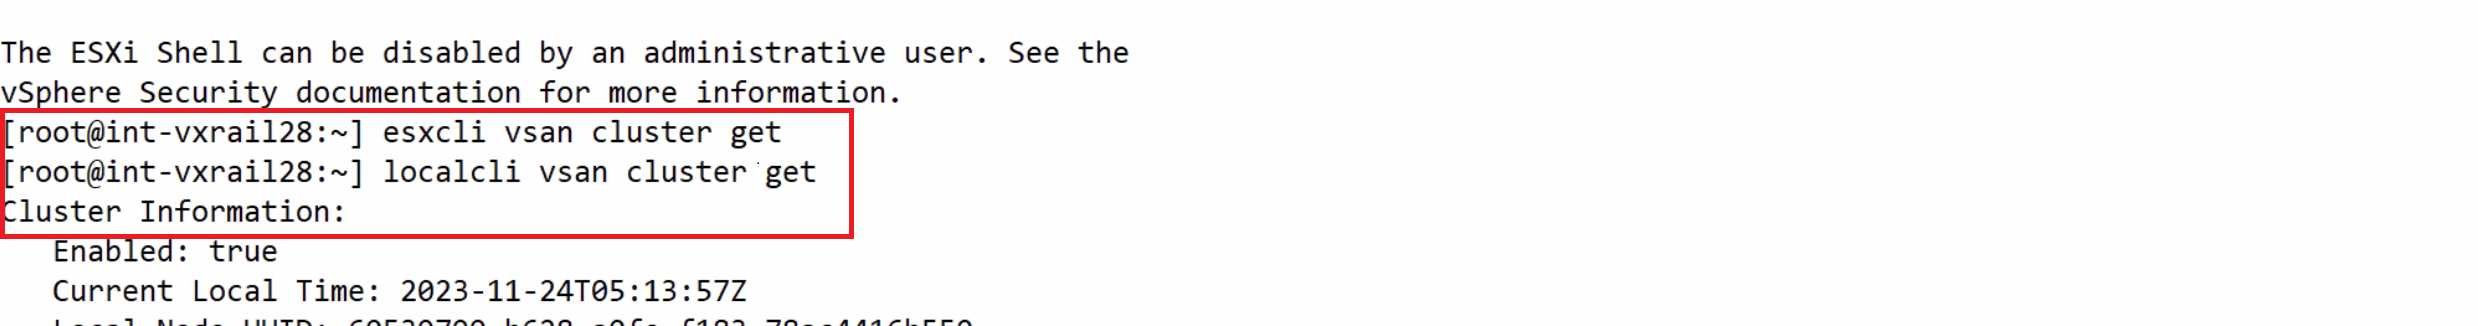
위에서 식별된 노드 SN을 기반으로 노드에 로그인하고 다음을 실행합니다.
esxcli명령을 실행했는데 멈췄지만 localcli가 작동합니다.
Cause
노드에 NTP 동기화 문제가 발생하여 esxcli 명령이 중단되고 응답이 없습니다.
VxRail 물리적 보기 호출 esxcli 펌웨어 정보를 검색하기 위해 노드의 명령을 실행하면 노드가 실행 중에 중단될 때 정보를 가져오지 못합니다. esxcli 사용해야 합니다.
Resolution
해결 방법은 모든 노드에서 NTP 동기화 문제를 식별하고 수정하는 것입니다. 노드에서 NTP의 상태를 확인하려면 아래 단계를 참조하십시오.
-
/var/log/vobd.log에서 시스템 클록이 더 이상 업스트림 시간 서버와 동기화되지 않음을 나타내는 오류 메시지가 있는지 확인합니다.
-
이 경우 NTP 서버 상태를 확인합니다.
#ntpq -p

"reach" 값이 377이 아닌 경우 호스트에 NTP 트랜잭션이 누락된 것입니다. 이 ESXi의 시간이 올바르지 않을 수 있으며 주의가 필요합니다.
#ntpq -c

"계층" 값이 2에서 6 사이의 범위를 벗어나면 이 ESXi의 시간 동기화가 추가로 지연되어 시간 기록이 부정확해질 수 있습니다.
-
VxRail Manager 데이터베이스의 NTP 서버 주소가 API와 올바른지 확인하십시오.
curl -k --user "[vCenter account]:[vCenter password]" --request GET "https://localhost/rest/vxm/v1/system/ntp"
-
그렇지 않은 경우 기존 '방법' 절차(VxRail → 기타 → '방법' 절차 → VxRail IP 주소 변경 → 새 NTP 서버 IP 주소로 다시 지정)에 따라 NTP 서버 IP 주소를 업데이트합니다.
-
필요한 경우 작동하는 다른 NTP 서버를 사용하고 노드 vpxa 및 호스트 서비스를 다시 시작합니다. 노드 vpxa 및 호스트 서비스를 다시 시작하면 문제가 일시적으로 해결되지만 NTP가 다시 동기화되지 않으면 문제가 반환됩니다.
/etc/init.d/vpxa restart
/etc/init.d/hostd restart
Affected Products
VxRailArticle Properties
Article Number: 000224344
Article Type: Solution
Last Modified: 24 May 2024
Version: 2
Find answers to your questions from other Dell users
Support Services
Check if your device is covered by Support Services.