PowerFlex: How To Collect Logs from Various Platforms In PowerFlex
Summary: The document contains information about how to collect different kinds of logs in PowerFlex. It helps the user to know why these logs are required and what information they hold.
This article applies to
This article does not apply to
This article is not tied to any specific product.
Not all product versions are identified in this article.
Instructions
Below are the steps to generate PowerFlex logs for different codes and generations:
- PowerFlex Manager Logs: Steps for PowerFlex Manager 3.8 or PowerFlex Manager 4.x
- iDRAC TSR logs: Steps for 13G and 14G
- PowerFlex OS
Get_infologs; these logs should be generated from a primary MDM with admin login - PowerFlex GW logs
- CloudLink logs
- VMware Logs
Generate the logs that are only relevant to your issue and your system code.
PowerFlex Manager Logs:
PowerFlex Manager logs collect the entire service details including all the nodes in that service.
PowerFlex Manager 3.8
Steps:
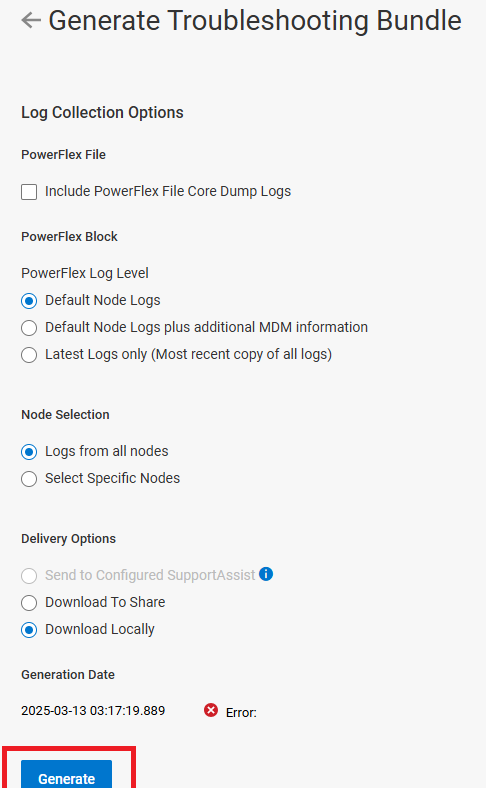
- Open PowerFlex Manager UI.
- Click Services
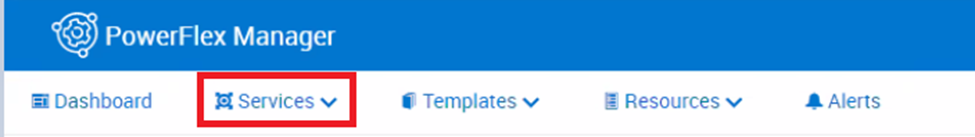
- Select the wanted service.
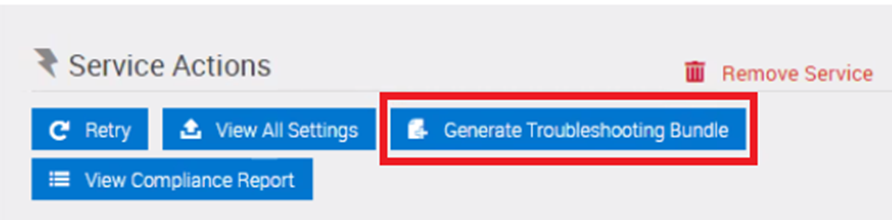
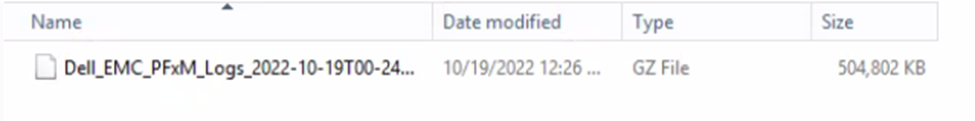
- Under Service Actions, click Generate Troubleshooting Bundle.
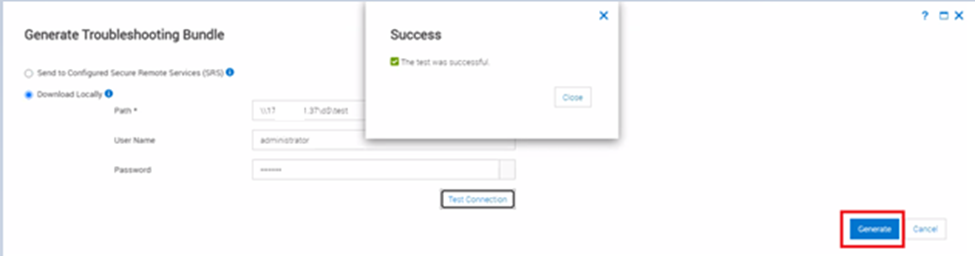
- Enter the path and press on Test Connection. The test should be successful.
- Click Generate to download the logs.
- Monitor the Job running in PFxM for log collection.
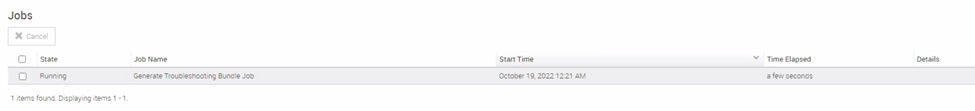
The process takes time according to the size of the service and the number of nodes in it. Once finished, the logs appear on the wanted location.
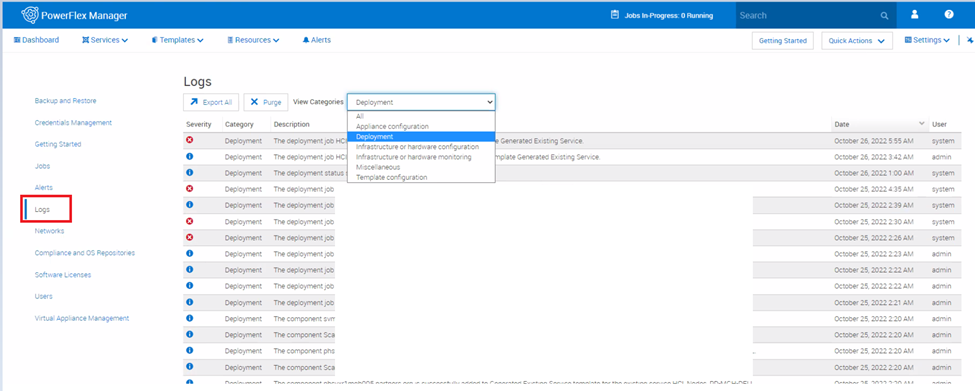
PowerFlex Manager also provides activity logs of user and system-generated actions to use for troubleshooting. By default, log entries display in order of occurrence.
To Export logs:
- On the menu bar, click Settings > Logs.
- Under View Categories, select the category of logs you want to access.
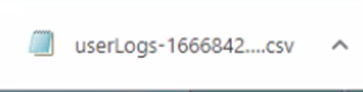
- Click Export All. The logs are exported to a CSV file.
PowerFlex Manager 4.x
Steps:
- Open PFMP UI using IP or FQDN name
- Go to Settings > Serviceability > Generate Troubleshooting Bundle
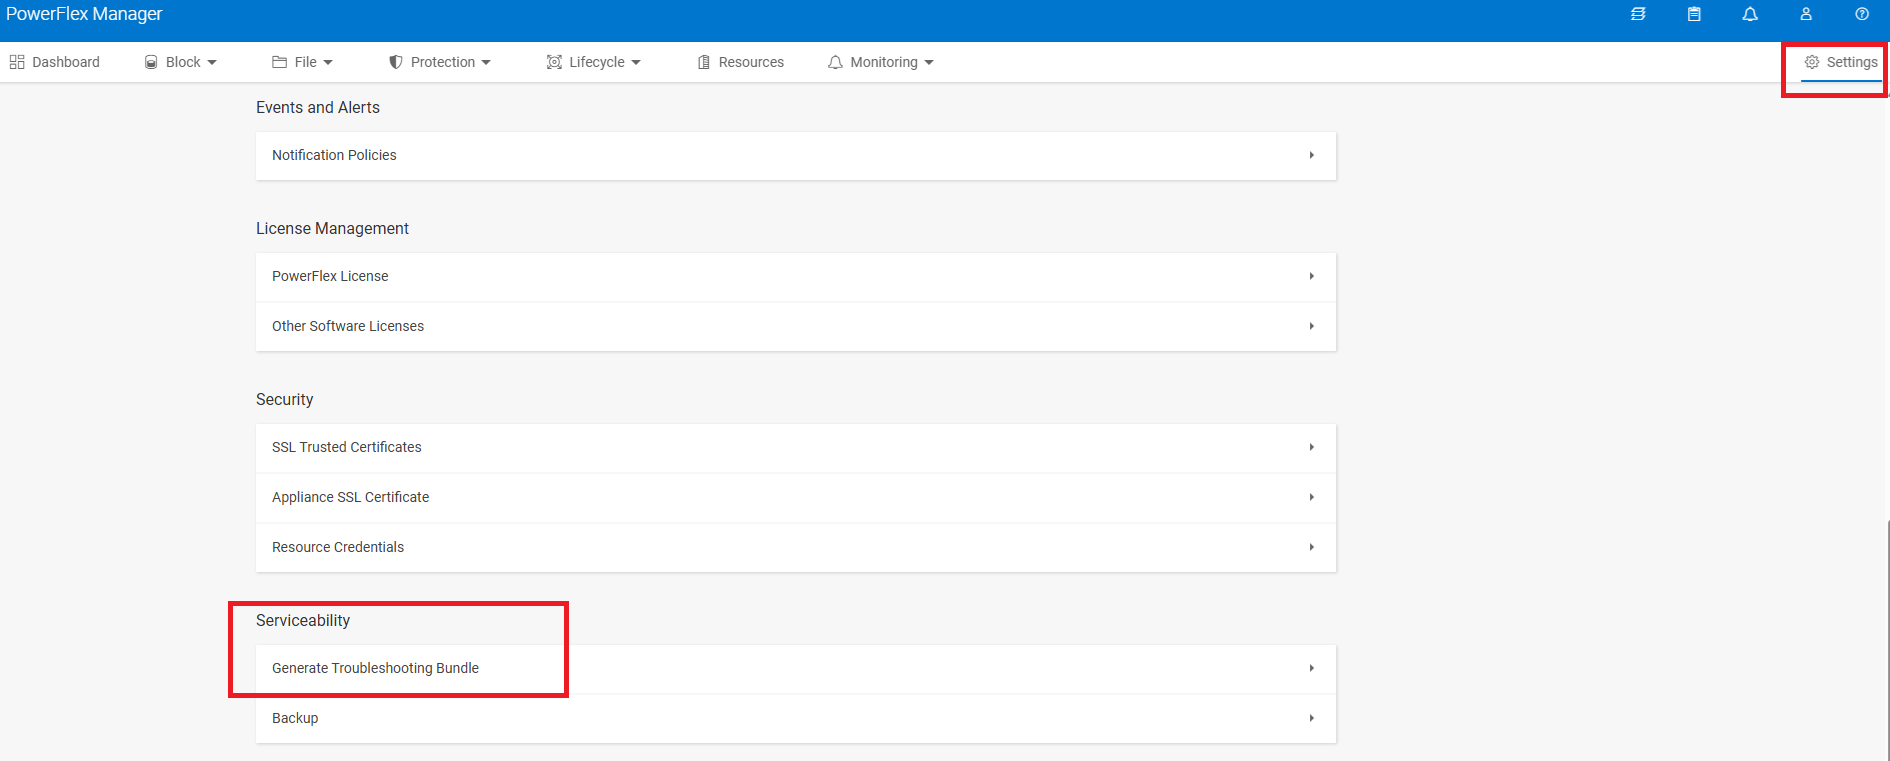
- Use the default values and Generate
iDRAC server logs:
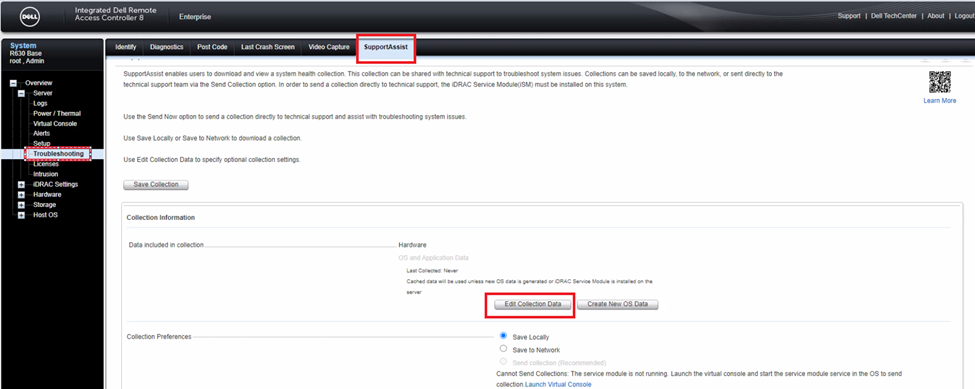
13G node SupportAssist Collection and RAID Controller Log
SupportAssist Collection (formally known as Tech Support Report/TSR) and the RAID Controller log provide detailed information about the status of system, firmware, and storage. Especially the RAID log is the most requested report by Dell support for troubleshooting storage issues.
Steps:
- Open iDRAC and click Troubleshooting > SupportAssist.
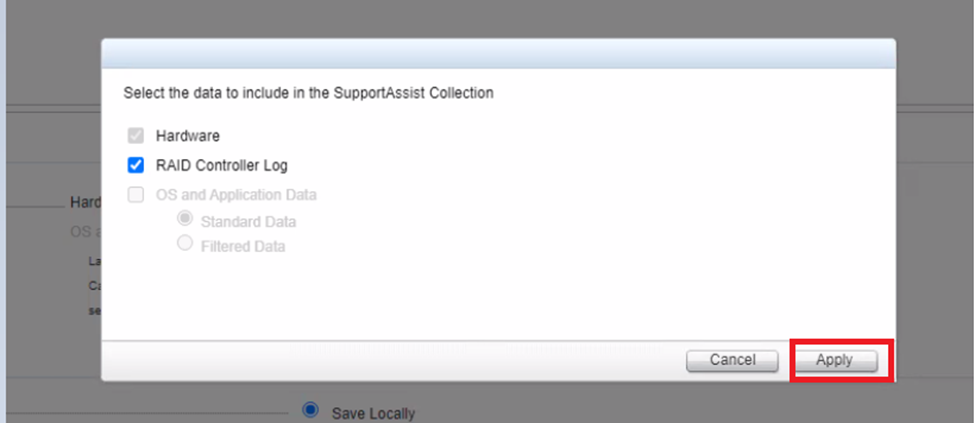
- Click Edit Collection Data and select the data to include in the logs; either Hardware or RAID Controller Logs or both and click Apply.
- Click Save the Collection.
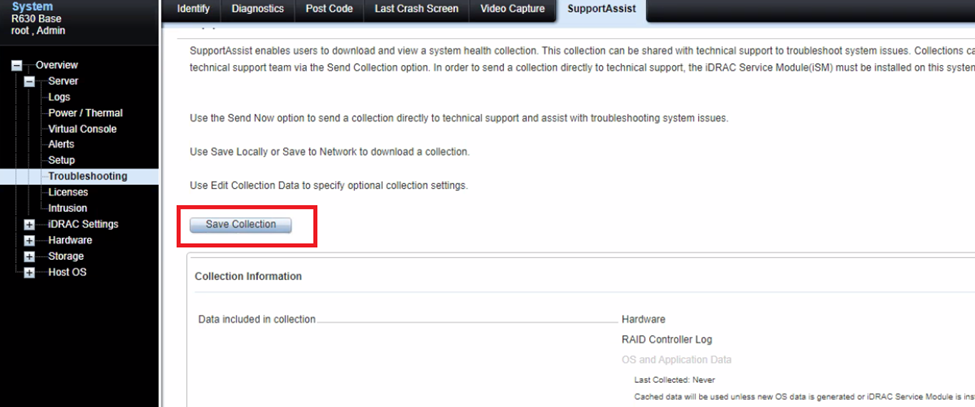
- Monitor the progress on the same page.
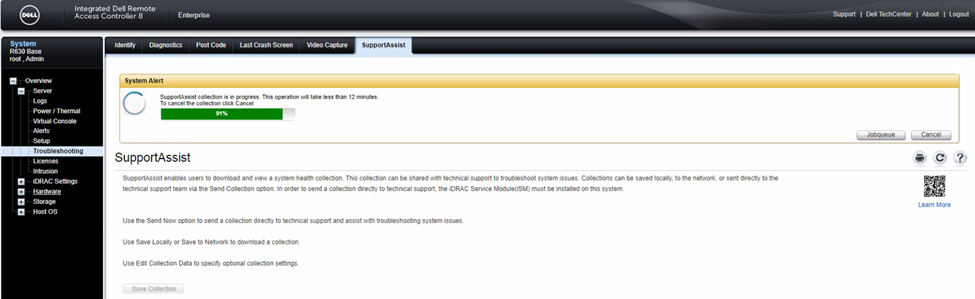
- Once finished, click OK.
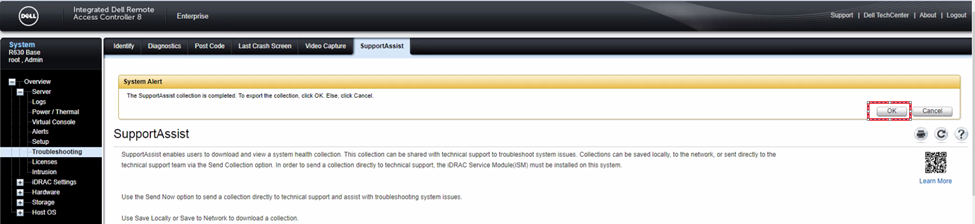
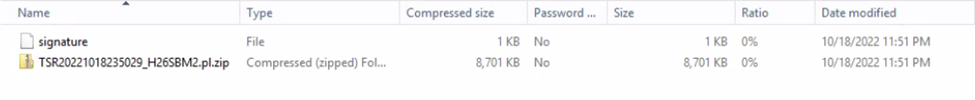
Logs get saved in the default folder.
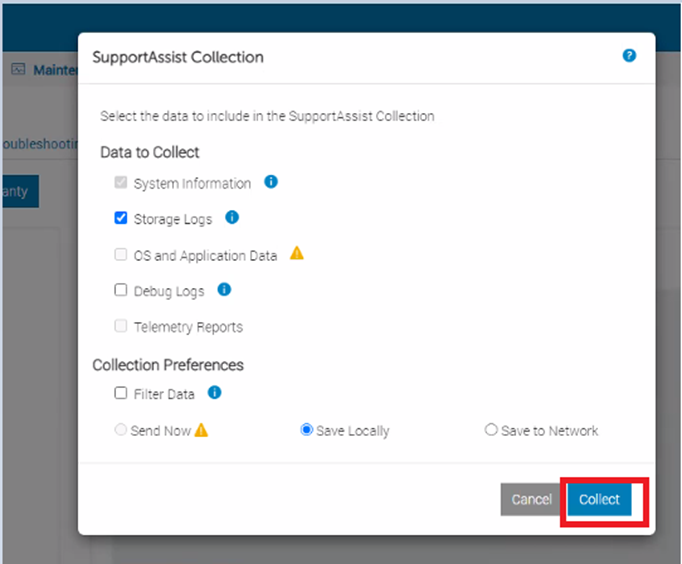
14G node SupportAssist Collection
Steps:
- Launch the iDRAC UI and click Maintenance tab.
- Click SupportAssist and press Start a Collection.
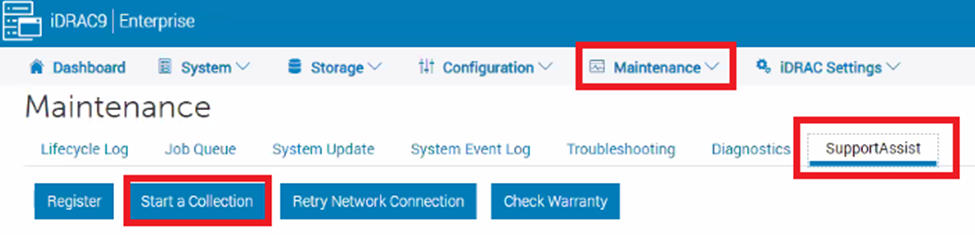
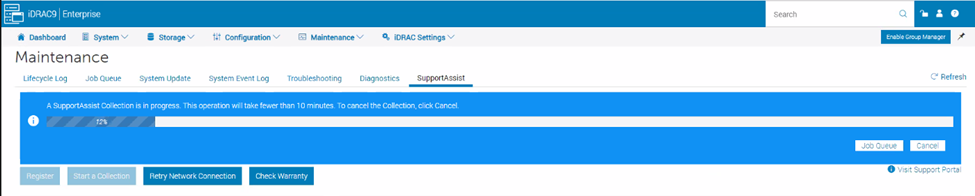
- Select the Data to Collect and choose your preference and click Collect.
- Monitor the progress at the top of your screen.
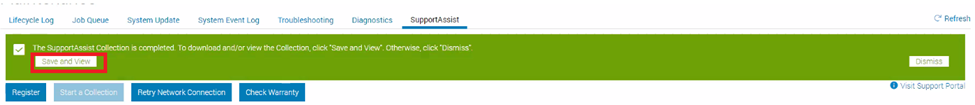
- Once completed, click Save and View, it is saved at the required location.
Get Info Logs
Get info logs should be collected from the Primary MDM with admin login and from any impacted SDS node.
SDS steps:
- SSH to SVM IP using root credentials
- Run
/opt/emc/scaleio/sds/diag/get_info.sh - Under the username, type Admin and it starts collecting the logs.
Note: if you are collecting logs from the Primary MDM, use the below command path with admin login.
PowerFlex 3.x
/opt/emc/scaleio/mdm/diag/get_info.sh -u admin -p <admin password>PowerFlex 4.x
scli --login --username admin --password <admin_password> --management_system_ip <PFMP_UI_IP> -fIf the Certificate is not added, run the below command and try login again:
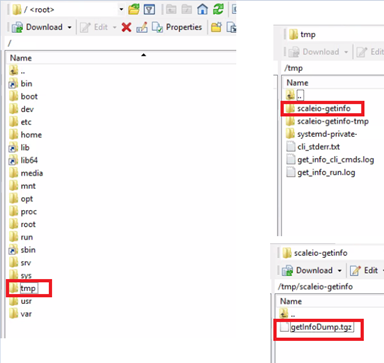
scli --add_certificate --certificate_file /opt/emc/scaleio/mdm/cfg/mgmt_ca.pem Once completed, logs get stored in the tmp/scaleio-getinfo folder which can be collected using any file transfer tool such as WinSCP.
Retrieve PowerFlex 3.x Installer/Gateway Logs
Installation Manager creates logs during installation, repair, and uninstallation.
Steps:
- Open the Gateway UI and login using admin credentials.
- From the Installer main menu, select Maintain. The Maintenance operation view appears.
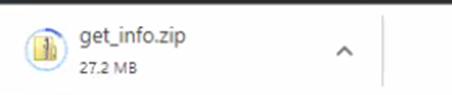
- Click the Download Installation Manager Logs. The PowerFlex Installer logs are collected as a single ZIP file in the browser-configured location.
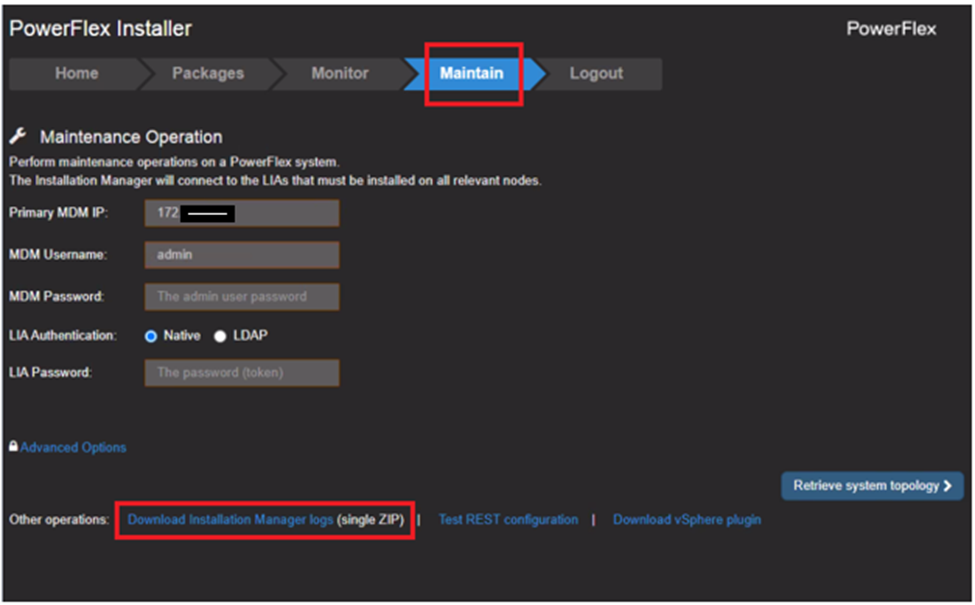
- Monitor the progress at the bottom of the screen.
Another method to collect Gateway logs is below:
Steps:
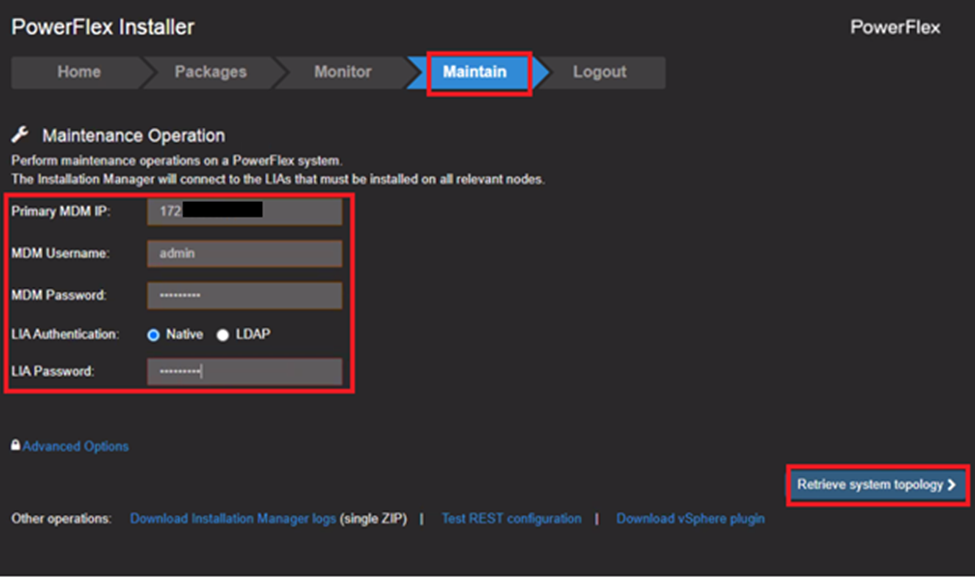
- Log in to the Gateway UI with admin credentials and click Maintain
- Enter Primary MDM IP address, MDM username, MDM password, and LIA password.
- Click Retrieve System Topology.
- Click System Logs and Analysis.
- From the list, select Collect Logs.
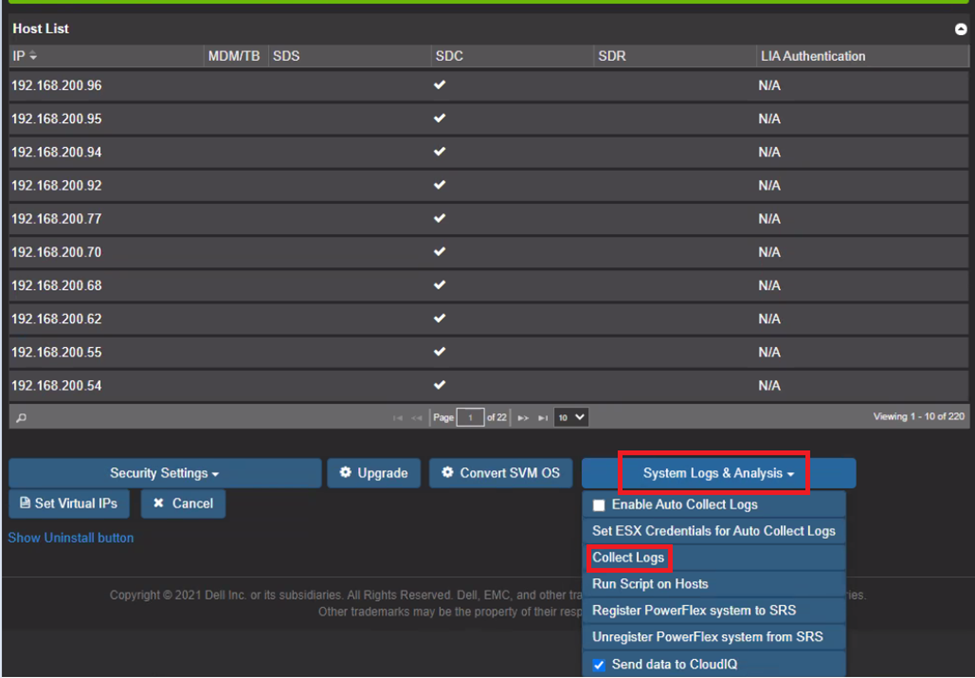
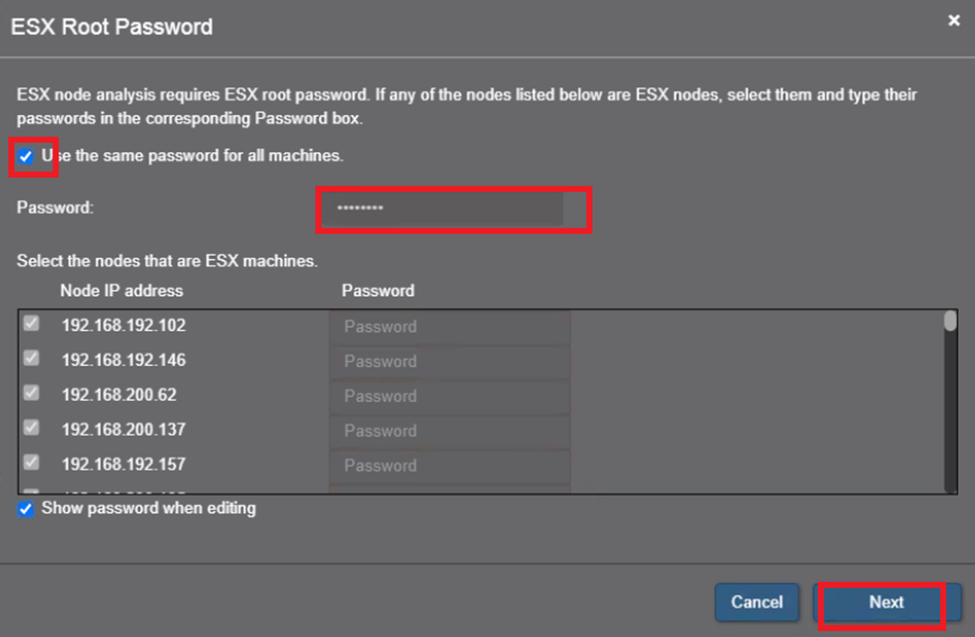
- Enter ESXi root password and click Next.
- Enter MDM password and click Collect Logs.
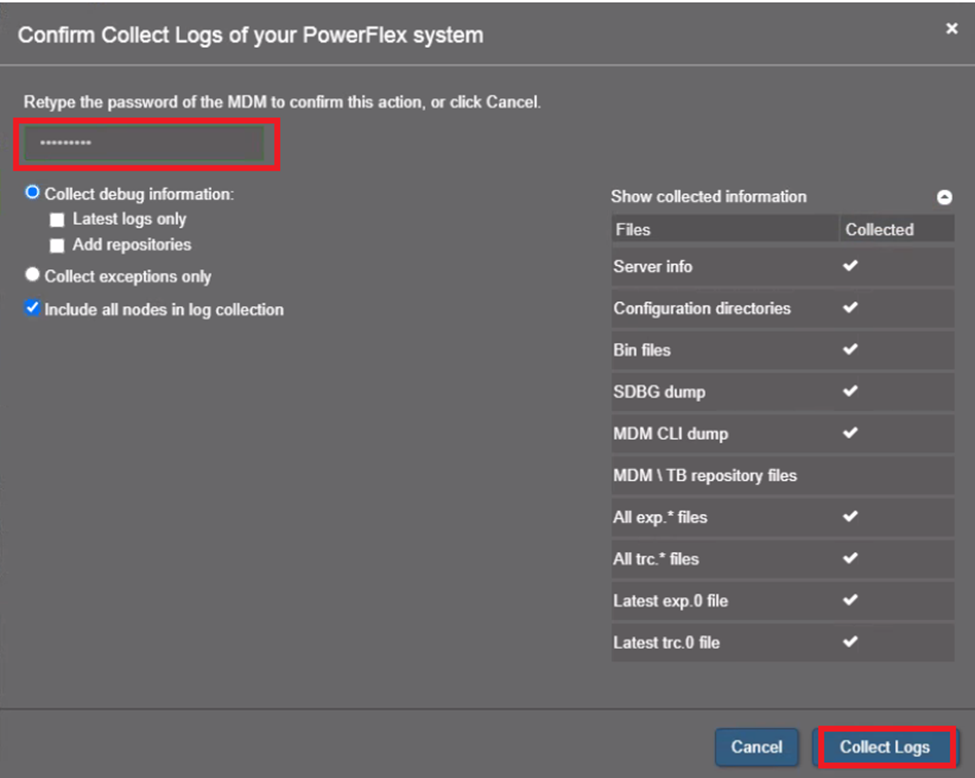
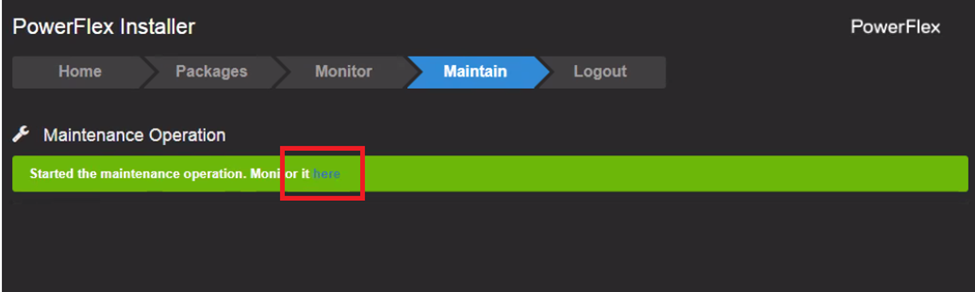
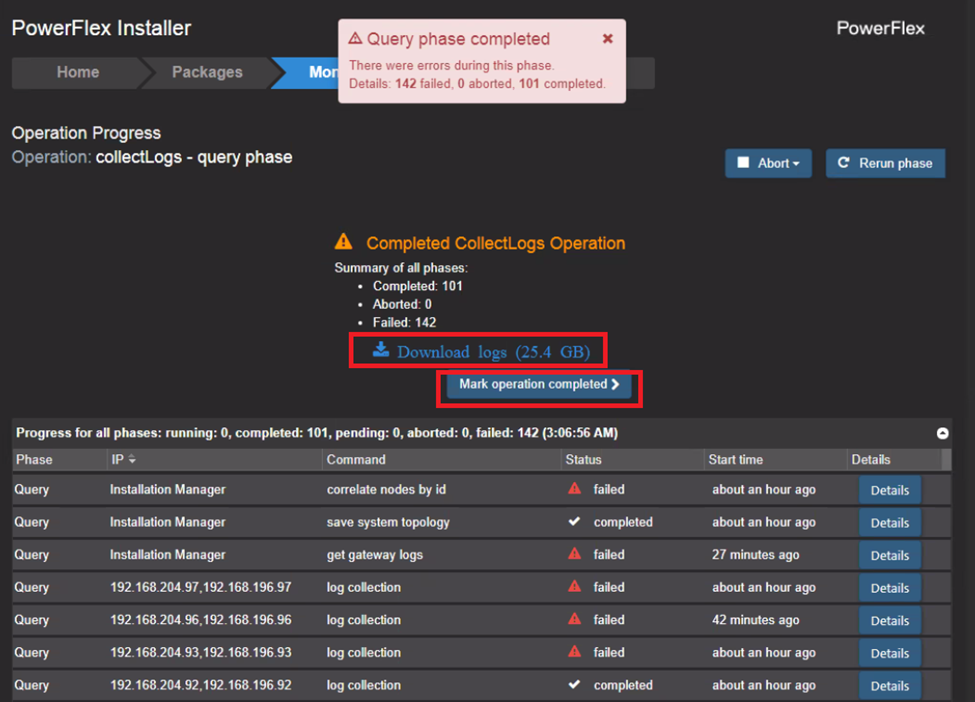
The Get Info operation, the log collection function of the PowerFlex Installer, begins.
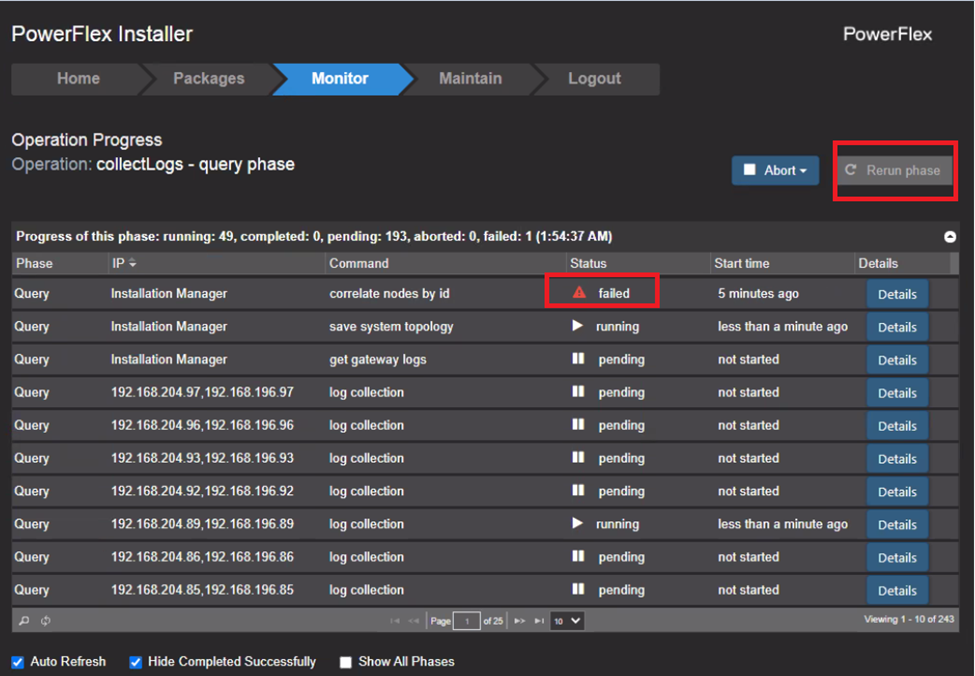
- Select the Monitor tab. Log collection progress is displayed.
If Status shows failed, rerun the phase.
- When the Get Info operation is complete, click Download logs to download the log files. A ZIP file containing all PowerFlex component logs is downloaded.
- Click Mark operation completed to clear the log files from the PowerFlex Installer
CloudLink Logs:
Follow the procedure to download all the CloudLink Center log files in a compressed ZIP file. For example, when reporting an issue to Dell Technologies Customer Support, this file is required.
Steps:
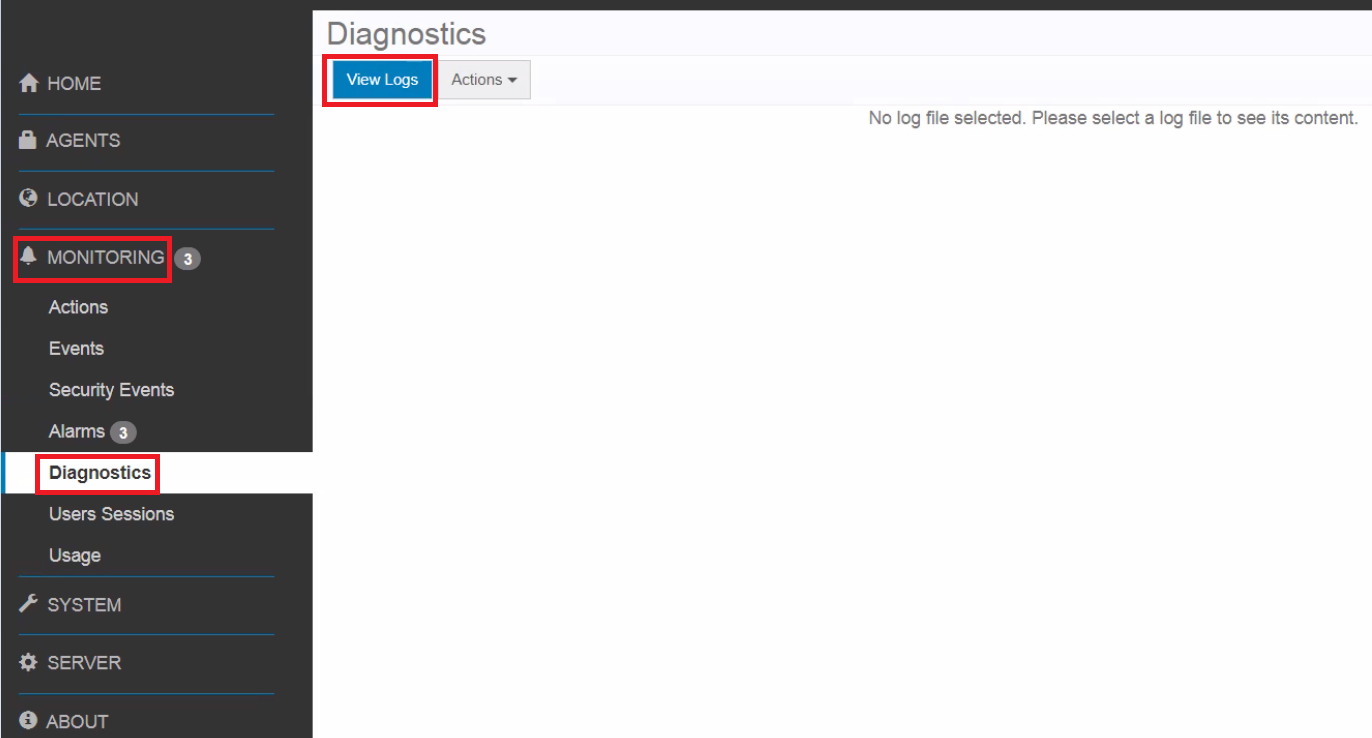
- Log in to CloudLink Center.
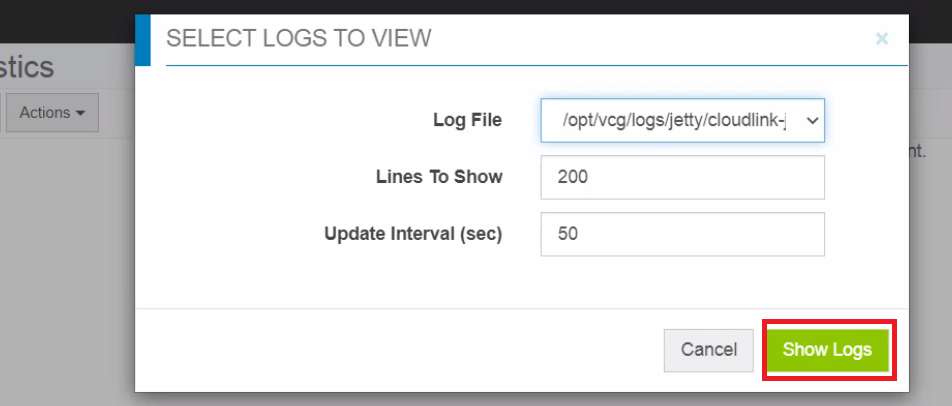
- Click Monitoring > Diagnostics.
- Click View Logs
- In the Select Logs To View dialog box, select a log file, and enter the required values for which you want to download the log files.
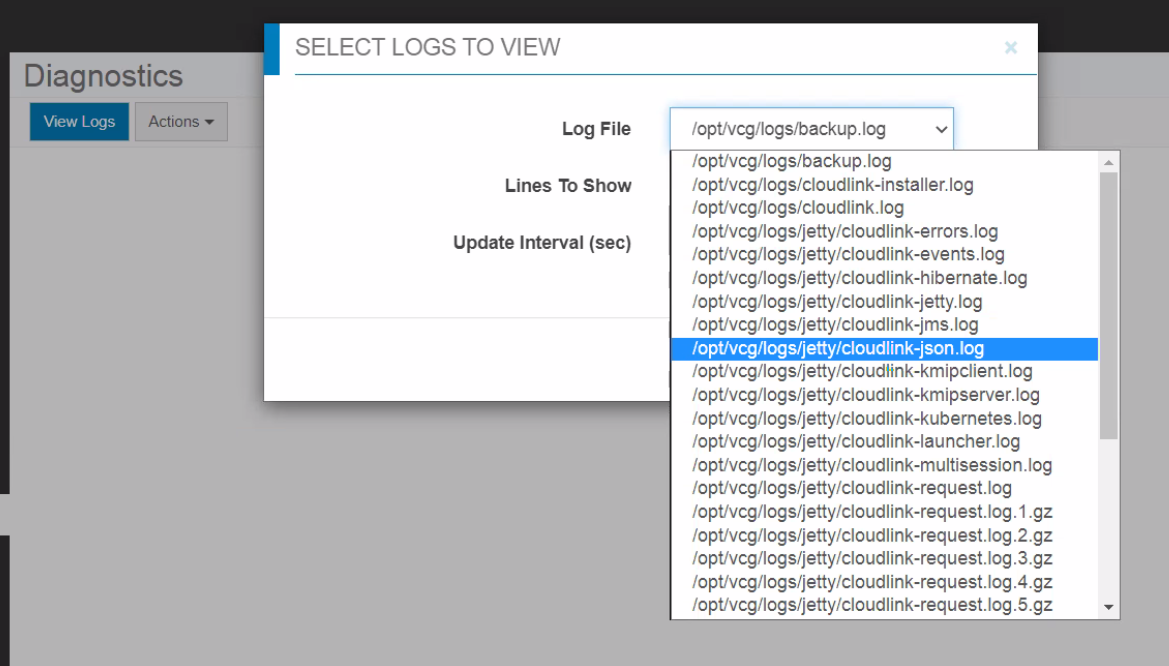
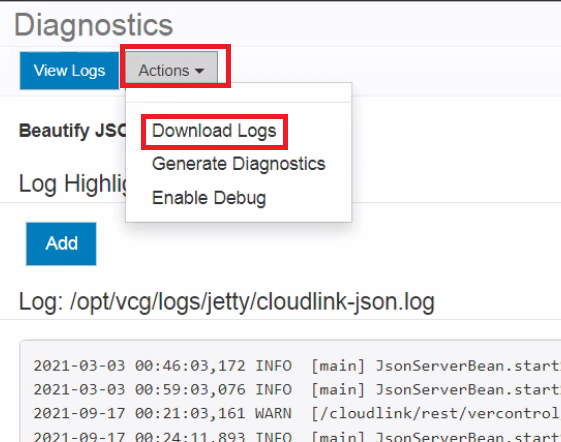
- Click Show Logs. The required log file is displayed.
- Click Actions > Download Logs. The log file is downloaded to the Downloads folder.
VMware logs:
One ESXI host logs:
VMware log files are important because they allow you to find the root cause of a problem or point out that something is about to break. If something strange is happening within your infrastructure, the first thing to do is gather and check the logs.
Steps:
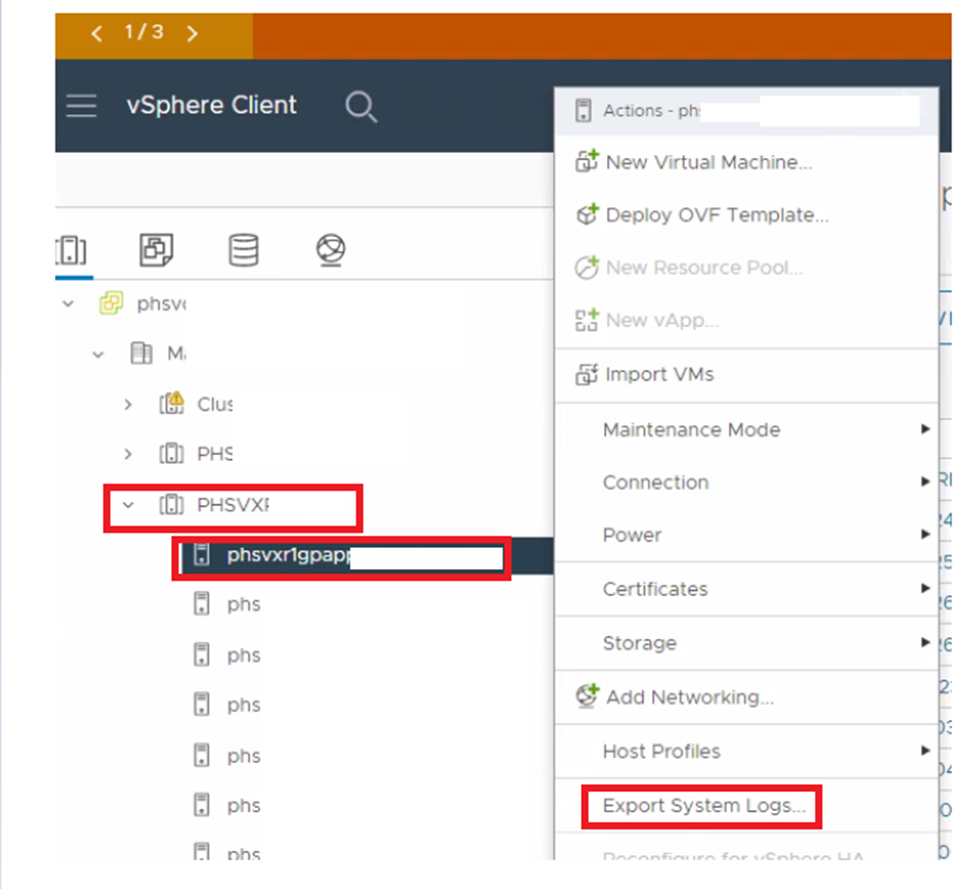
- Open vCenter UI.
- Select the Cluster.
- Click drop-down and right click the wanted host.
- Click Export System Logs.
- Select or Clear required logs and click Export Logs.
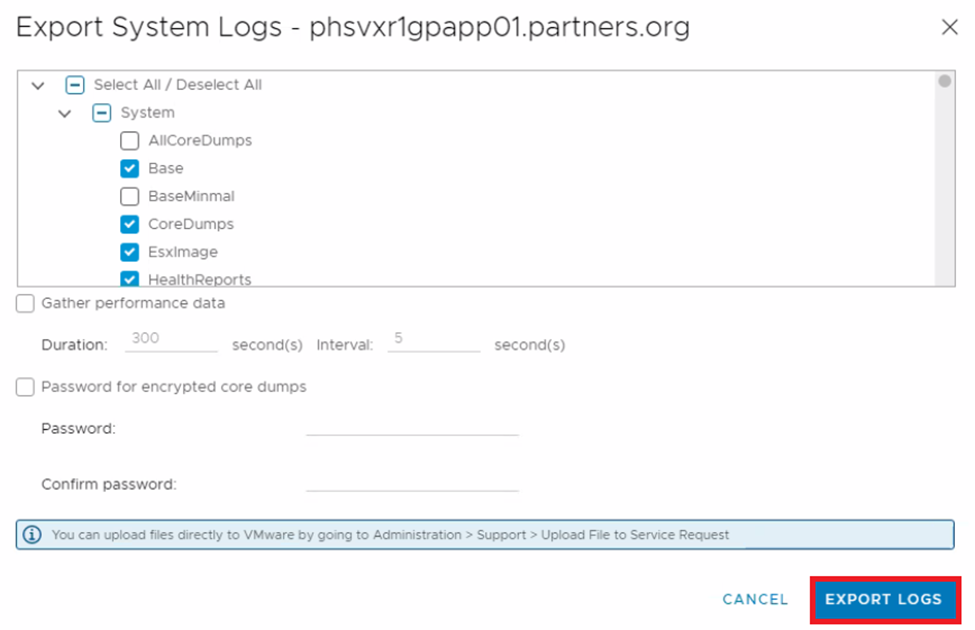
- Monitor the progress at the bottom of your screen.

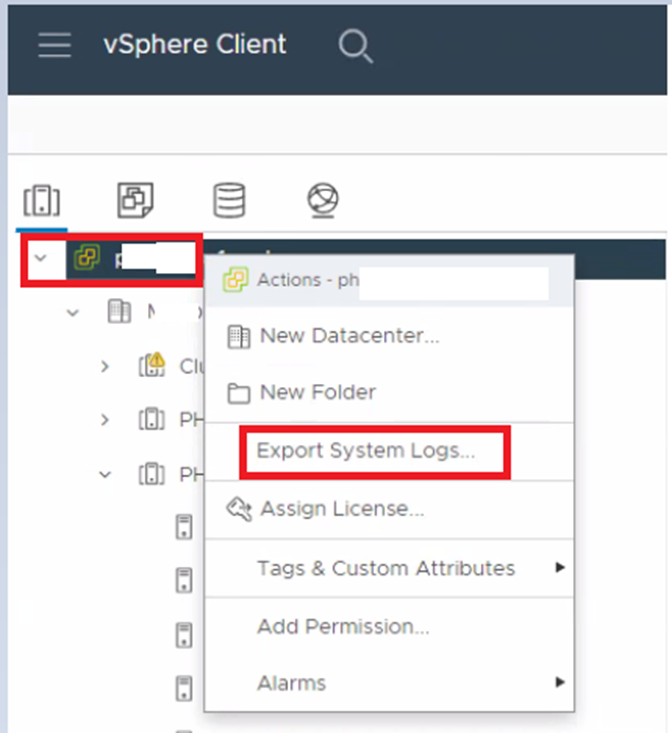
Multiple or All ESXI Hosts Logs:
vCenter allows us to select multiple or all hosts as well.
Steps:
- Select and right click vCenter.
- Click Export System logs.
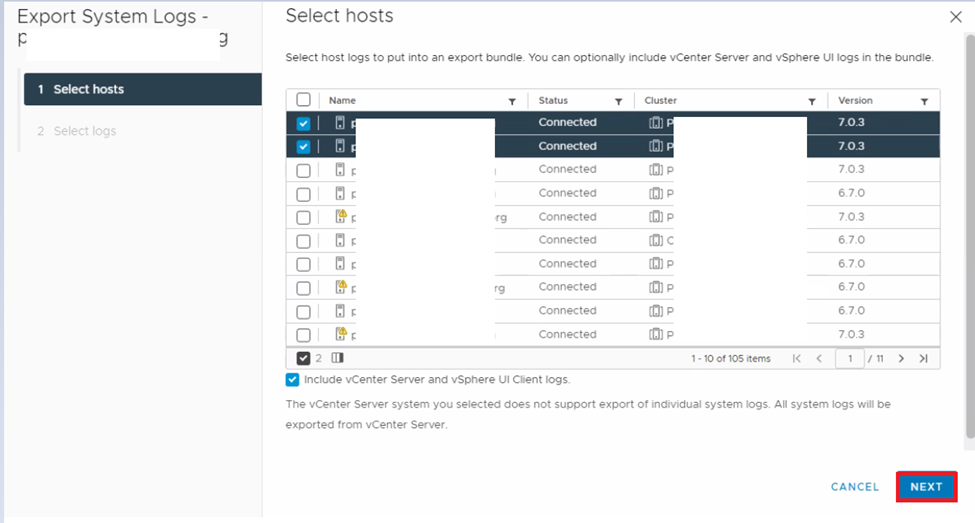
- Select hosts and click Next.
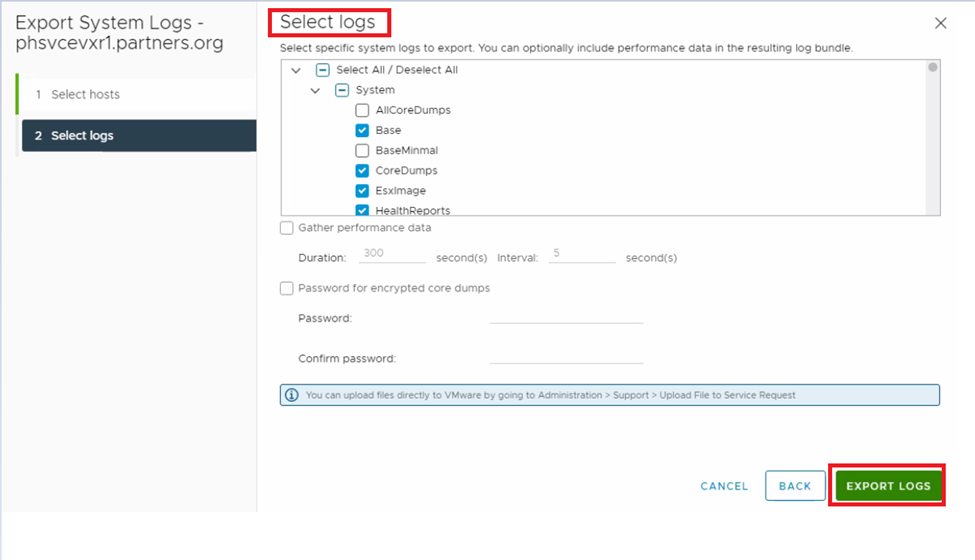
- Select or Clear required logs and click Export Logs.
Affected Products
PowerFlex rack, ScaleIOArticle Properties
Article Number: 000205078
Article Type: How To
Last Modified: 18 Feb 2026
Version: 7
Find answers to your questions from other Dell users
Support Services
Check if your device is covered by Support Services.